
Usability Enhancements
Many usability enhancements have been made to the web-based manager in FortiOS 5.2, in order to make the configuration process more efficient. New usability enhancements include:
- FortiView Dashboards
- FortiExplorer Setup Wizard Improvements
- Interfaces List Improvements
- Dragging Objects Between Policies in the Policy List
- Cloning Table Objects
- DHCP-related Improvements in the Web-based Manager
- System Resources Widget
- License Information Widget
- USB Modem Widget
- New Feature Settings Preset
- Improved Banned User List Page
- Replacement Message Improvements
- Sorting and Filtering Support for the Virtual IP list
- Web-based Manager Options for the FortiGate-30D
FortiView Dashboards
|
|
In order for information to appear in the FortiView dashboards, disk logging must be selected for the FortiGate unit. To select disk logging, go to Log & Report > Log Config > Log Settings. Disk logging is disabled by default for some FortiGate units. To enable disk logging, enter the following command in the CLI: config log disk setting set status enableendPlease note that flash-based logging has been disabled in FortiOS 5.2 for certain models. To view a complete list of affected models, please refer to the Release Notes. |
The FortiView dashboards integrate real time and historical dashboards into a single view. These dashboards can be found by going to Status > FortiView. Each dashboard will initially display the top 100 sessions but when the results are filtered, other sessions may be displayed.
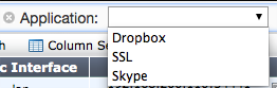
Each dashboards can be filtered by a variety of attributes. Attributes can be selected by using the dropdown menu located at the top of each widgets that displays only the options that have results; for example, if the only applications used in the are Dropbox, SSL, and Skype, the only options in the dropdown menu for the Application filter will be Dropbox, SSL, and Skype.
Filtering for Applications
Results can also be filtered using the various columns, although not all columns support this.
The dashboards also include different time options, allowing you to see current traffic in real-time, or historical traffic that occurred in the last 5 minutes, 1 hour, or 24 hours.
|
|
Historical traffic is only supported on FortiGate models that have local storage. The 24 hours option is also unavailable for desktop models (FortiGate-90 series and below). |
Sources
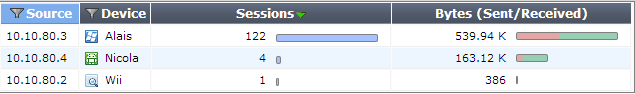
The Sources dashboard shows information about the sources of traffic on your FortiGate unit, including user and device. Additional columns show information about sessions and bytes sent or received.
This dashboard can be filtered by source IP, source device, source interface, destination interface, and policy ID.
The Sources dashboard
Applications
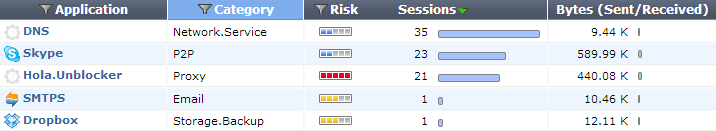
The Applications dashboard shows information about the applications being used on your network, including application name, category, and risk level. Additional columns show information about sessions and bytes sent or received.
This dashboard can be filtered by application, source interface, destination interface, and policy ID.
|
|
In order for information to appear in the Applications dashboard, application control must be enabled in a policy. |
The Applications dashboard
Cloud Applications
The Cloud Applications dashboard shows information about the cloud applications being used on your network, including application name, category, risk level, login IDs, and, if applicable, the number of videos played. If the cursor is held over the column showing the number of videos, the titles of these videos will be shown. Additional columns show information about sessions and bytes sent or received.
Two different views are available for the Cloud Applications dashboard: applications and users. Applications shows a list of the programs being used. Users shows information on the individual users of the cloud applications, including the username if the FortiGate was able to view the login event.
This dashboard can be filtered by application, source interface, destination interface, and policy ID.
|
|
In order for information to appear in the Cloud Applications dashboard, an application control profile that has Deep Inspection of Cloud Applications turned on must be enabled in a policy and SSL Inspection must use deep-inspection (for more information, see "SSL Inspection"). |
The Cloud Applications dashboard

Destinations
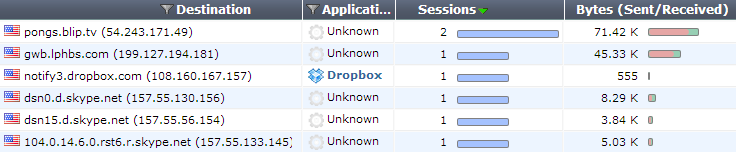
The Destinations dashboard shows information about the destination IPs of traffic on your FortiGate unit, as well as the application used. Additional columns show information about sessions and bytes sent or received.
This dashboard can be filtered by destination IP, user, source interface, destination interface, and policy ID.
The Destinations dashboard
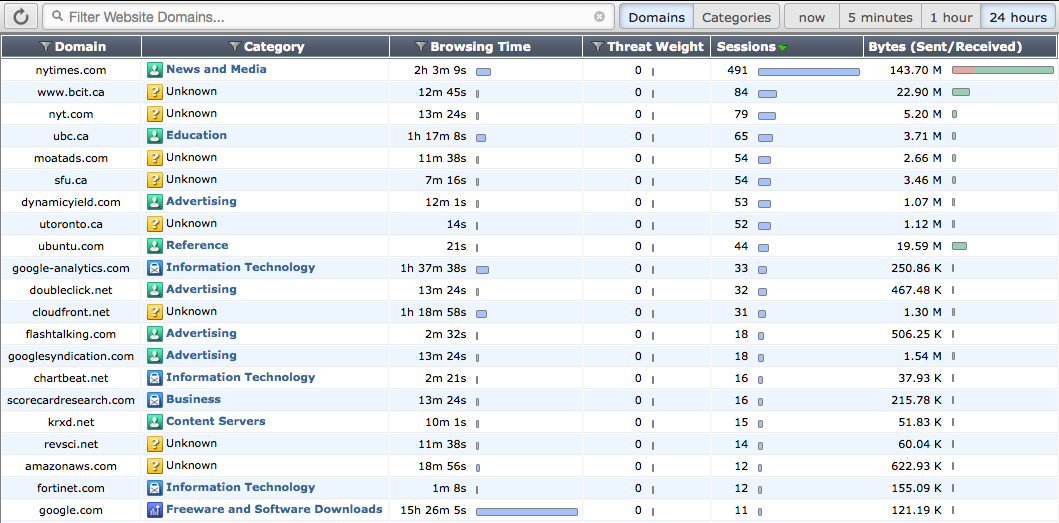
Websites
The Websites dashboard lists the top allowed and top blocked web sites. You can view information by domain or by FortiGuard categories by using the options in the top right corner. Each FortiGuard category can be clicked on in order to see a description of the category and several example sites, with content loaded from FortiGuard on demand. New icons have also been added for FortiGuard category groups. Additional information is provided about domain, browsing time, threat weight, sources, and bytes sent or received.
This dashboard can be filtered by source interface, domain, destination interface, and policy ID.
|
|
In order for information to appear in the Websites dashboard, web filtering must be enabled in a policy, with FortiGuard Categories enabled. |
The Websites dashboard
Threats
The Threats dashboard lists the top users involved in incidents, as well as information on the top threats to your network. Additional information is provided about the threat, category, threat level, threat weight, and number of incidents.
This dashboard can be filtered by source interface, threat type, threat, destination interface, and policy ID.
|
|
In order for information to appear in the Threats dashboard, Threat Weight Tracking must be used. |
The Threats dashboard

All Sessions
The All Sessions dashboard shows information about all FortiGate traffic. To choose which columns you wish to view, select Column Settings and place your desired columns in the right-hand box, in the order that you wish them to appear.
This dashboard can be filtered by source IP, destination IP, application, source device, source interface, destination interface, and policy ID. If you have set a filter in a different dashboard before viewing the All Sessions dashboard, that filter will remain until manually cleared.
The All Sessions dashboard
Drilldown Options
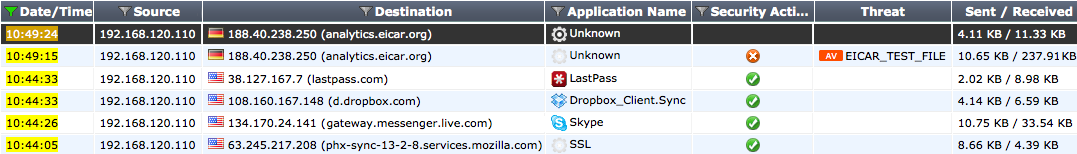
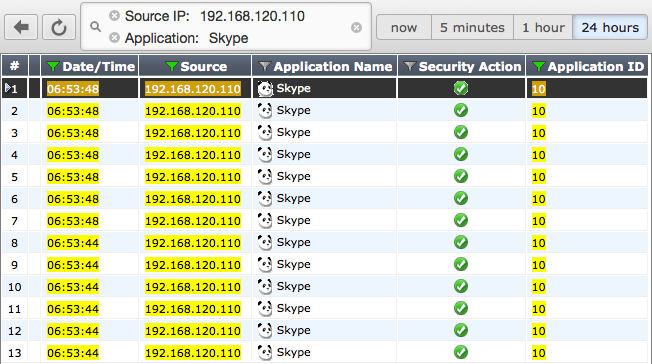
In all FortiView dashboards except for the All Sessions dashboard, you can view more information about a particular session by right-clicking or double-clicking on the session to display the Drilldown to details... option, which opens a summary page that includes further information about applications, sources, destinations, and sessions where applicable.
From this summary page, you can access automatically filtered logs that will show a list of applicable sessions. For example, if you have picked the IP address 192.168.120.110 from the Sources dashboard, you can then select Drilldown to details... for Skype from the Applications column. This will open a log that displays all sessions from 192.168.1.1 that used Skype. From this page, you can select Drilldown to details... for any individual session, in order to view the log entry for that session.
Viewing Skype sessions from the Source Address 192.168.120.110
In the All Sessions dashboard, filters are also used to narrow down what results are shown. If you are viewing historical traffic in the All Sessions dashboard, you can also add an element to a filter by right-clicking the element and selecting Set Filter.
Sniffer Traffic Support
Historical traffic logging with the FortiView dashboards is supported for sniffer traffic.
FortiExplorer Setup Wizard Improvements
Several improvements have been made to the FortiExplorer Setup Wizard.
Removed Features
Several features have been removed from the FortiGate Setup Wizard:
- Central management configuration
- UTM: AntiSpam setup
- UTM: IPS setup
- Virtual Servers
The WAN Topology options have also been simplified so that the only option is Single Ethernet.
FortiWiFi
Several additional changes have occurred for FortiWiFi units, found in the LAN + WiFi Settings section of the wizard:
- The default SSID is now named
fortinetXXXX, where XXXX is the last 4 digits of the FWF serial number. - The default SSID is bridged with the internal network.
- The default pre-shared key is different for each FortiWiFi unit.
- A Show Password option has been added.
Internet Access
The following changes have been made to the Internet Access section of the wizard:
- Selecting Block Viruses and Malicious Content enables anti-virus and web filtering
- The MPAA rating system is used for Parental Controls
Remote VPN
In the Remote VPN section, an option has been added to setup dynamic DNS with FortiGuard. The option is enabled by default.
AntiVirus Inspection Mode
If the flow-based AntiVirus database is not enabled, the setup wizard will change the default profile to proxy-based.
Interfaces List Improvements
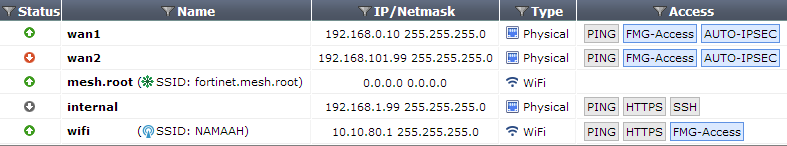
Several improvements have been made to the Interfaces List:
- Only interfaces with tunnels or VPNs expand to show more information.
- The Status column shows the number of clients using the interface. Clicking on the number in the status column will direct you to the DHCP Monitor or wireless Client Monitor, depending on which type of clients are using the interface.
- The protocols listed in the Access column have been assigned color codes. Secure services (HTTPS, SSH) are listed in grey, insecure services (TELNET, HTTP without HTTPS redirect enabled) are listed in red, and all other services are listed in blue.
The Interfaces list
Dragging Objects Between Policies in the Policy List
Objects can now be moved or copied from one policy to another in the policy list. This includes source and destination addresses, services, users, user groups, and security profiles. The default “none” object is also included.
Because of this change, a blank policy can now be created, with the configuration determined by dragging elements from other policies.
Cloning Table Objects
Table objects can now be cloned, allowing an existing object to be copied and given a new name. The object's properties can then be configured by selecting Edit.
Cloning is enabled for both Firewall Objects and Security Profiles.
DHCP-related Improvements in the Web-based Manager
A number of improvements have been made in the web-based manager, relating to DHCP:
- A DHCP Server column has been added to the interface list that shows which interfaces have been enabled as a DHCP server and the assigned IP range.
- The DHCP Client List has been improved by adding device icons and changing the Expires column to show the amount of time left on the DHCP lease.
- New addressing modes have been added to support IPv6 and PPPOE. The option for IPv6 will only appear if it has been enabled in the web-based manager, while PPPOE options only appear if IPv4 addressing is set to PPPOE as well.
- Options have been added to DHCP Monitor, allowing DCCP leases to be revoked and IP reservations to be added or edited.
- Advanced DHCP configuration can now be done through the web-based manager. To enable this feature, the following syntax must be used in the CLI:
config system global
set gui-dhcp-advanced enable
end
After this has been enabled, an Advanced menu can be expanded when configuring DCHP on a network interface.
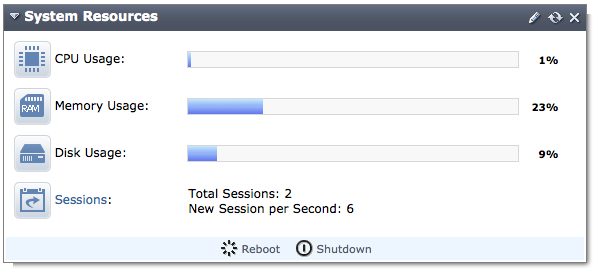
System Resources Widget
The appearance of the System Resource widget has been changed to better illustrate the large number of CPU cores. The IPMC sensors information, about temperature, fan, and power supply unit, has also been added to the widget for some FortiGate models.
System Resources widget (on a FortiGate-100D)
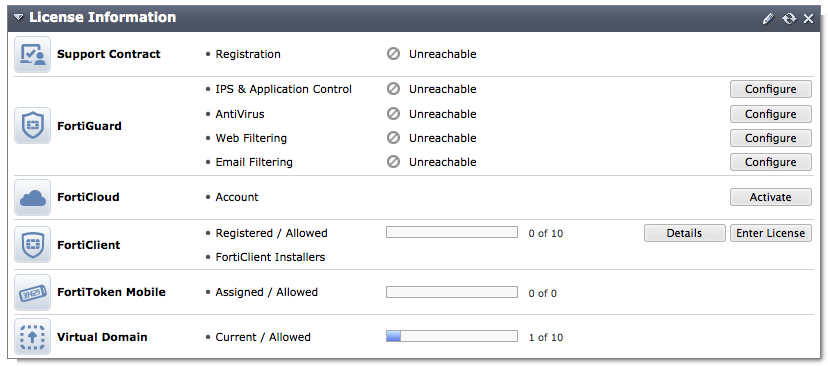
License Information Widget
The appearance of the License Information widget has changed to clearly show the current licenses of your FortiGate. A new option has also been added to extend a license, which allows you to add a new license as soon as you buy it, rather than having to wait for the current license to expire.
License Information widget
USB Modem Widget
The following changes have occurred to the USB Modem widget:
- The LOC number has been removed.
- SIM State and SIM card ID fields have been added.
- MEID will be displayed if a CDMA modem is used.
- IMEI will be displayed if a GSM modem is used.
New Feature Settings Preset
A new preset, UTM, has been added to the Feature Settings, which are set either using the Features widget or by going to System > Config > Features. This preset turns on the following features: antivirus, web filtering, application control, and end point control. This preset is the default setting for FortiGate models 200 and below.
The preset formerly known as UTM, which turns on all features, is now called full UTM.
Improved Banned User List Page
The banned user list has been improved by the following changes:
- Adding a search function
- Improving sorting through column filters
- Displaying information on the event that caused the user to be quarantined
Replacement Message Improvements
The process of creating replacement message using tags and images has been simplified by the following additions:
- A right-click menu to insert tags/images
- An auto-complete feature for tags (when you begins by entering %%)
- Descriptions for each tag that appear as they are typed
- Image previews when an image tag is used
- An graphics list that allows you to select from predefined images or upload a new image
- Variables for source IP (%%SOURCE_IP%%), destination IP (%%DEST_IP%%), and user name (%%USERNAME%%) can now be added.
Sorting and Filtering Support for the Virtual IP list
In FortiOS, the virtual IP list can be sorted and filtered, allowing for easier management.
Web-based Manager Options for the FortiGate-30D
The FortiGate-30D by default views a different version of the web-based manager than other units, known as gui-lite. This mode can be disabled in the CLI, in order to view the standard web-based manager.
Syntax
config system global
set gui-lite disable
end
Copyright © 2018 Fortinet, Inc. All Rights Reserved. | Terms of Service | Privacy Policy