
Using the Web-Based Manager
This section contains an introduction to the web-based manager administrative interface (sometimes referred to as a graphical user interface, or GUI) of your FortiGate unit and the information you can access from the various dashboards and tables.
The following topics are included in this section:
Connecting to the web-based manager
After you have completed the initial installation for your FortiGate unit, there are two ways to connect to the web-based manager: using FortiExplorer or a web browser.
FortiExplorer
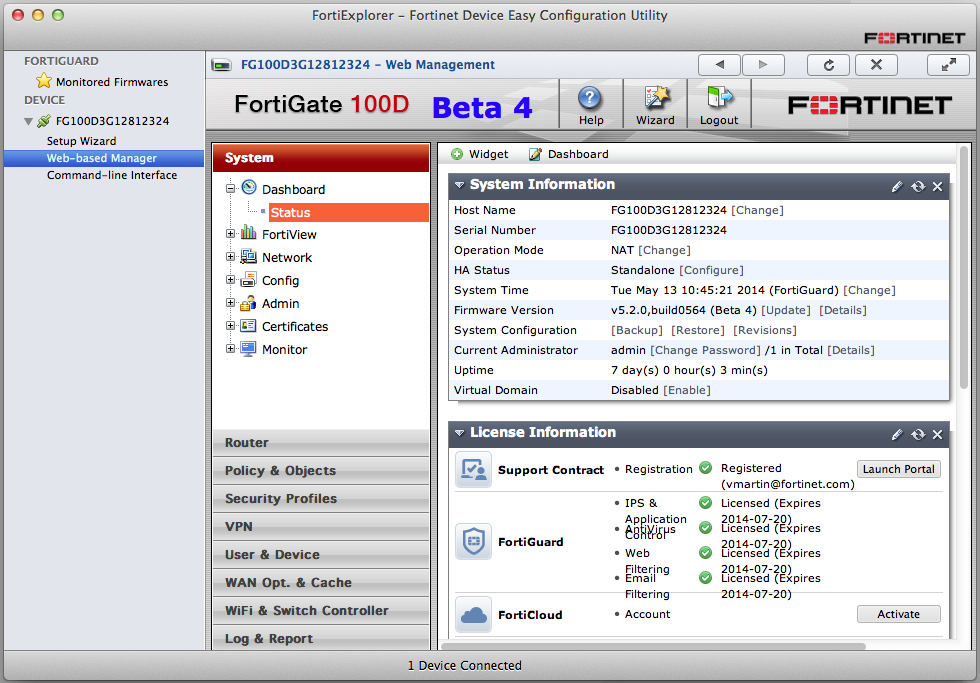
To connect to the web-based manager using FortiExplorer, connect your management computer to your FortiGate unit’s USB MGMT port, using the cable that came with the unit. FortiExplorer should open automatically once the devices are connected; if it does not, open the program manually.
To connect to the web-based manager, go to Devices > Web-based Manager and enter your username and password. If you have not changed the admin account’s password, use the default username, admin, and leave the password field blank.
The web-based manager will now be displayed in FortiExplorer.
Connecting to the web-based manager with FortiExplorer
Web browser
|
|
The recommended minimum screen resolution for properly displaying the web-based manager is 1280 by 1024. Check the FortiOS Release Notes for information about browser compatibility. |
In order to connect to the web-based manager using a web browser, an interface must be configured to allow administrative access over HTTPS or over both HTTPS and HTTP. By default, an interface has already been set up that allows HTTPS access, with the IP address 192.168.1.99.
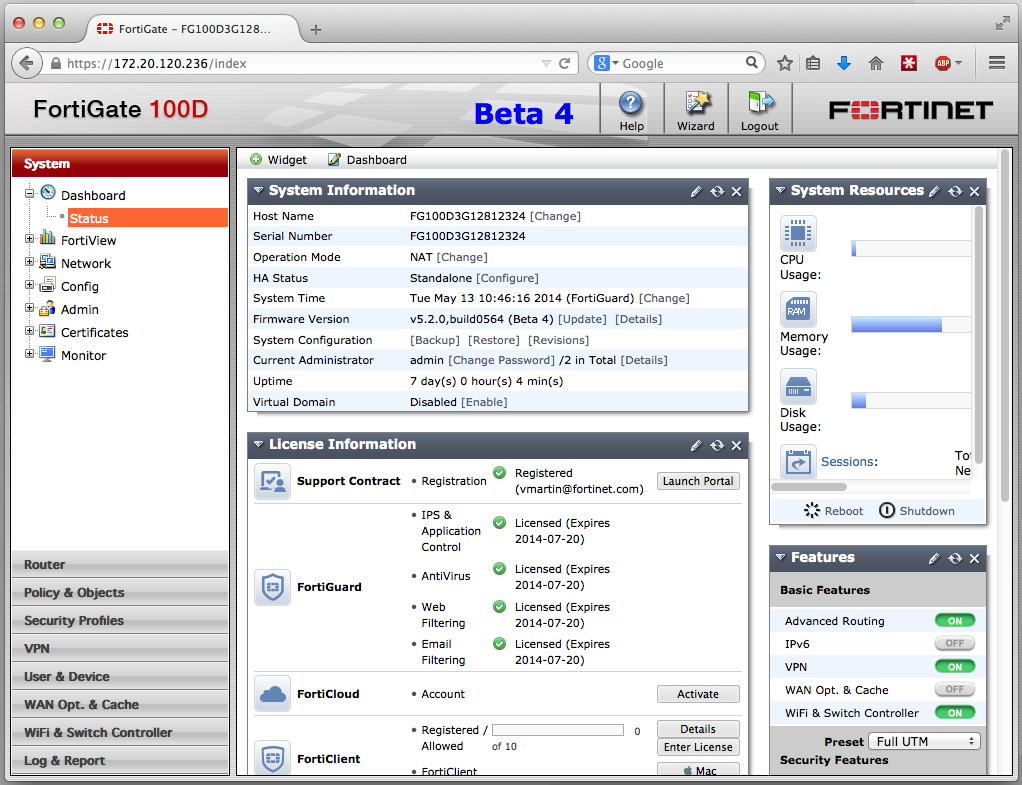
Browse to https://192.168.1.99 and enter your username and password. If you have not changed the admin account’s password, use the default username, admin, and leave the password field blank.
The web-based manager will now be displayed in your browser.
Connecting to the web-based manager with a web browser (Firefox)
If you wish to use a different interface to access the web-based manager, do the following:
- Go to System > Network > Interfaces and edit the interface you wish to use for access. Take note of its assigned IP address.
- Beside Administrative Access, select HTTPS. You can also select HTTP, although this is not recommended as the connection will be less secure.
- Select OK.
- Browse to the IP address using your chosen protocol.
The web-based manager will now be displayed in your browser.
Menus
|
|
Some menus may not initially appear on your FortiGate, while others only appear on certain FortiGate models or when certain features/modes are enabled. If there is a menu you believe your FortiGate model supports that does not appear in the web-based manager as expected, go to System > Config > Features and ensure the feature is turned on. For more information, see Feature settings. |
The web-based manager contains the following main menus, which provide access to configuration options for most of the FortiOS features:
| System | Configure system settings, such as network interfaces, virtual domains (VDOMs), DNS services, administrators, certificates, High Availability (HA), system time, set system options, and set display options on the web-based manager. The System menu also contains the Status and FortiView dashboards. For more information, see Dashboards . |
| Router | Configure static, dynamic and multicast routing and view the router monitor. On certain FortiGate models, routing is configured by going to System > Network > Routing. |
| Policy & Objects | Configure firewall policies, protocol options, the Central NAT Table, and supporting content for policies including scheduling, services, traffic shapers, addresses, virtual IP and load balancing. |
| Security Profiles | Configure antivirus and email filtering, web filtering, intrusion protection, data leak prevention, application control, VOIP, ICAP and Client Reputation. |
| VPN | Configure IPsec and SSL virtual private networking. |
| User & Device | Configure user accounts and user authentication including external authentication servers.This menu also includes endpoint security features, such as FortiClient configuration and application detection patterns. |
| WAN Opt. & Cache | Configure WAN optimization and web caching to improve performance and security of traffic passing between locations on your wide area network (WAN) or from the Internet to your web servers. |
| WiFi Controller | Configure the unit to act as a wireless network controller, managing the wireless Access Point (AP) functionality of FortiWiFi and FortiAP units. On certain FortiGate models, this menu is called WiFi & Switch Controller and has additional features allowing for FortiSwitch units to be managed by the FortiGate. |
| Log & Report | Configure logging and alert email as well as reports. View log messages and reports. |
| Current VDOM | This menu only appears when VDOMs are enabled on the unit and is used to switch between VDOMs. |
Dashboards
The various dashboard menus provides a way to access information about network activity and events, as well as configure basic system settings.
There are two main dashboards: the Status Dashboard and the FortiView Dashboards.
Status Dashboard
The Status Dashboard can be found by going to System > Dashboard > Status. The dashboard consists of a number of widgets, each displaying a different set of information. A number of pre-configured widgets are available which can be customized to meet your needs.
To choose which widgets will be shown, select Widget and select the widget you wish to view, which will add it to the dashboard. Widgets can be rearranged in the Status Dashboard for easier access and viewing. You can also change the display from two columns to one by selecting the Dashboard button, selecting Edit Dashboard and choosing the one column display from the options.
Custom Dashboards
You can create custom dashboards that will be added to the menu under the default Status Dashboard. You can add, remove, or rename a dashboard, regardless of whether it is default. You can also reset the Dashboard menu to its default settings by selecting Reset Dashboards.
If VDOMs are enabled, only the dashboards within Global are available for configuration.
To add a dashboard
- Go to System > Dashboard > Status.
- Select Dashboard, located at the top left of the page.
- Select Add Dashboard.
System Information
The System Information widget
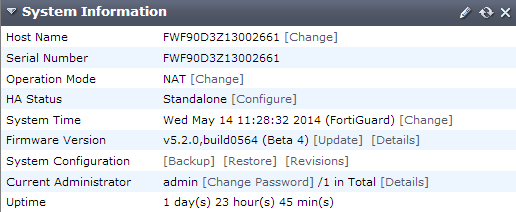
The System Information widget shows status information on the FortiGate unit. Some configuration details/modes can be changed through the widget.
| Host Name | The name of the FortiGate unit. If the FortiGate unit is in HA mode, this information is not displayed. |
| Serial Number | The serial number of the FortiGate unit. The serial number is specific to that FortiGate unit and does not change with firmware upgrades. |
| Operation Mode | The current operating mode of the FortiGate unit (a FortiGate unit can operate in NAT mode or Transparent mode). If virtual domains are enabled, this field shows the operating mode of the current virtual domain. The Global System Status dashboard does not include this information. |
| HA Status | The status of High Availability (HA) within the cluster. Standalone indicates the FortiGate unit is not operating in HA mode. Active-Passive or Active-Active indicate the FortiGate unit is operating in HA mode. Select Configure, to change the HA configuration. |
| Cluster Name | The name of the HA cluster for this FortiGate unit. The FortiGate unit must be operating in HA mode to display this field. |
| Cluster Members | The FortiGate units in the HA cluster. Information displayed about each member includes host name, serial number, and whether the FortiGate unit is a primary (master) or subordinate (slave) FortiGate unit in the cluster. The FortiGate unit must be operating in HA mode with virtual domains disabled to display this information. |
| Virtual Cluster 1 Virtual Cluster 2 |
The role of each FortiGate unit in virtual cluster 1 and virtual cluster 2. The FortiGate unit must be operating in HA mode with virtual domains enabled to display this information. |
| System Time | The current date and time. |
| Firmware Version | The version of the current firmware installed on the FortiGate unit. |
| System Configuration | The time period of when the configuration file was backed up. |
| Current Administrator | The number of administrators currently logged into the FortiGate unit. Select Details to view more information about each administrator that is currently logged in |
| Uptime | The time in days, hours, and minutes since the FortiGate unit was started or rebooted. |
| Virtual Domain | Status of virtual domains on your FortiGate unit. This information will only appear when VDOMs have been enabled. |
| Explicit Proxy Load Balance |
The status of each feature. Select Enable or Disable to change the status of the feature. When enabled, the menu option appears. This information will only appear when redundant Internet connections are enabled. |
System Resources
The System Resources widget
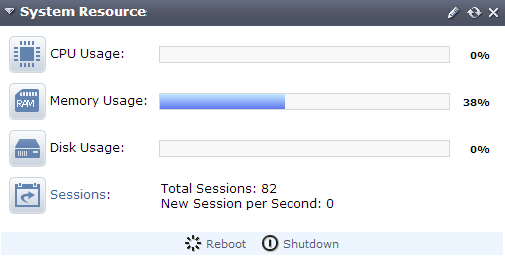
The System Resources widget displays basic FortiGate unit resource usage. This widget displays the information for CPU and memory in either real-time or historical data. For FortiGate units with multiple CPUs, you can view the CPU usage as an average of all CPUs or each one individually.
This widget also is where you reboot or shutdown the FortiGate unit.
|
|
The options to reboot or shutdown the FortiGate unit are not available for an admin using the prof_admin profile. |
USB Modem
The USB modem widget
The USB modem widget enables you to monitor the status of your USB modem and configure it as needed.
License Information
The License Information widget
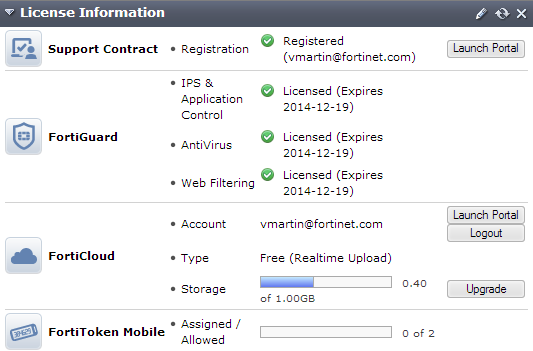
The License Information widget displays the status of your technical support contract, FortiGuard subscriptions, FortiCloud account, and other licenses.
When a new FortiGate unit is powered on, it automatically searches for FortiGuard services. If the FortiGate unit is configured for central management, it will look for FortiGuard services on the configured FortiManager system. The FortiGate unit sends its serial number to the FortiGuard service provider, which then determines whether the FortiGate unit is registered and has valid contracts for FortiGuard subscriptions and FortiCare support services. If the FortiGate unit is registered and has a valid contract, the License Information is updated.
When a license is near to its expiry date, an option to extend it will appear that allows you to add a new license as soon as you buy it.
| Support Contract | Displays details about your current Fortinet Support contract. If Not Registered appears, select Register to register the FortiGate unit. If Expired appears, select Renew for information on renewing your technical support contract. Contact your local reseller. If Registered appears, the name of the support that registered this FortiGate unit is also displayed. The various types of contracts that you currently have and the expiry date for each type. You can select Launch Portal to log into the Fortinet Support account that registered this FortiGate unit. |
| FortiGuard Services | Displays your current licenses for services from FortiGuard. Select Extend or Renew to update any of the licenses (these options only appear when a license is expired or close to expiry). |
| FortiCloud | Displays details about your current FortiCloud subscription. If the green Activate button appears, select it to either create a new account or add the FortiGate unit to an existing account. If you have already activated FortiCloud, the name of the Account will be listed. Select Launch Portal to view your FortiCloud account in a web browser. Information on the current Type and Storage is also listed. You can select Upgrade to change the type of your FortiCloud account. |
| FortiClient Software | Displays FortiClient license details and the number of Register and Allowed FortiClient users. You can select Details for more information about the current FortiClient users. This information will only appear when you have a FortiClient license. |
| FortiToken Mobile | Displays the number of Assigned and Allowed FortiTokens. |
| SMS | Displays the number of Sent and Allowed SMS messages. You can select Add Messages to configure a new SMS message. This information will only appear when SMS has been configured. |
| Virtual Domain | Displays the maximum number of virtual domains the FortiGate unit supports with the current license. For some FortiGate models, you can select the Purchase More link to purchase a license key through Fortinet technical support to increase the maximum number of VDOMs. |
Alert Message Console
The Alert Messages Console widget
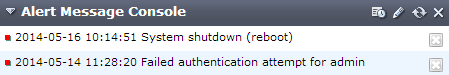
The Alert Messages Console widget helps you monitor system events on your FortiGate unit such as firmware changes, network security events, or virus detection events. Each message shows the date and time that the event occurred.
You can configure the alert message console settings to control what types of messages are displayed on the console.
To configure the Alert Message Console
- Locate the Alert Message Console widget within the Dashboard menu.
- Select the Edit icon in the Alert Message Console title bar.
- Select the types of alerts that you do not want to be displayed in the widget.
- Select OK.
Advanced Threat Protection Statistics
The Advanced Threat Protection Statistics widget
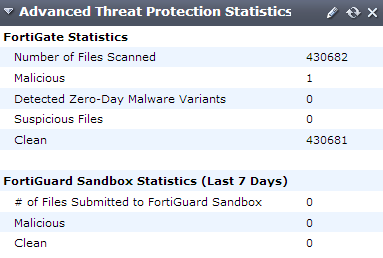
The Advanced Threat Protection Statistics widget displays a count of detected malware and files scanned for these types of intrusions. It also displays statics on the number of files sent to FortiGuard Sandbox and the results from sandboxing.
Unit Operation
The Unit Operation widget
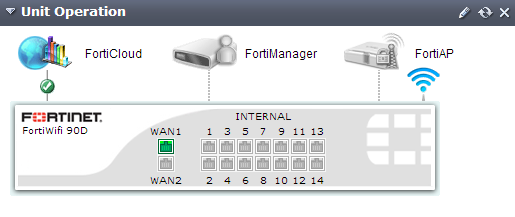
The Unit Operation widget is an illustrated version of the FortiGate unit’s front panel that shows the status of the FortiGate unit’s network interfaces. Interfaces appears green when connected. Hover the mouse pointer over an interface to view further details.
Icons around the front panel indicate when the FortiGate unit is connected to a FortiAnalyzer or FortiManager device, or FortiClient installations. Select the icon in the widget to jump to the configuration page for each device. When connected to one of these devices, a green check mark icon appears next to the icon. If the device communication is configured but the device is unreachable, a red X appears.
CLI Console
The CLI Console widget
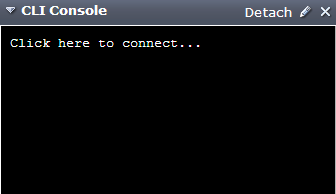
The CLI Console widget enables you to access the CLI without exiting from the web-based manager.
The two controls located on the CLI Console widget title bar are Customize, and Detach.
- Detach moves the CLI Console widget into a pop-up window that you can resize and reposition. Select Attach. to move the widget back to the dashboard’s page.
- Customize enables you to change the appearance of the console by selecting fonts and colors for the text and background.
Features
The Features widget
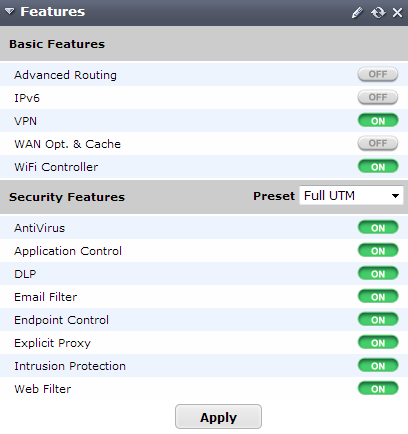
The Features widget displays a number of Basic Features and Security Features and whether or not each feature is currently enabled or disabled. Options for features that are disabled will not appear in the web-based manager.
For more information, see Feature settings.
RAID monitor widget
The RAID Monitor widget displays the current state of the RAID array and each RAID disk. This widget does not display unless the FortiGate unit has more than one disk installed and is not available for FortiOS Carrier.
| Array status icon | Displays the status of the RAID array. • Green with a check mark shows a healthy RAID array. • Yellow triangle shows the array is in a degraded state but it is still functioning. A degraded array is slower than a healthy array. Rebuild the array to fix the degraded state. • A wrench shows the array is being rebuilt. Positioning the mouse over the array status icon displays a text message of the status of the array. |
| Disk status icon | There is one icon for each disk in the array. • Green with a check mark shows a healthy disk. • Red with an X shows the disk has failed and needs attention. Positioning the mouse over the disk status icon displays the status of the disk, and the storage capacity of the disk. |
| RAID Level | The RAID level of this RAID array. The RAID level is set as part of configuring the RAID array. |
| Status bar | The bar shows the percentage of the RAID array that is currently in use. |
| Used/Free/Total | Displays the amount of RAID array storage that is being used, the amount of storage that is free, and the total storage in the RAID array. The values are in gigabytes. |
Interface History
The Interface History widget
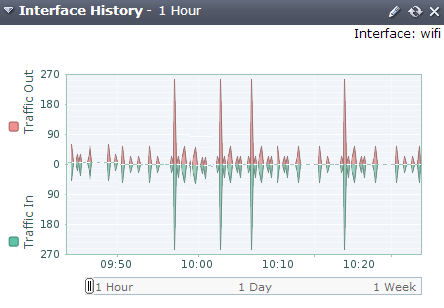
The Interface History widget displays the current activity and activity history of a system interface.
The current interface is visible in the top right-hand corner of the widget. You can change the interface that is shown by selecting the Edit icon and set Select Network Interface to the interface of your choice.
All Sessions
The All Sessions widget
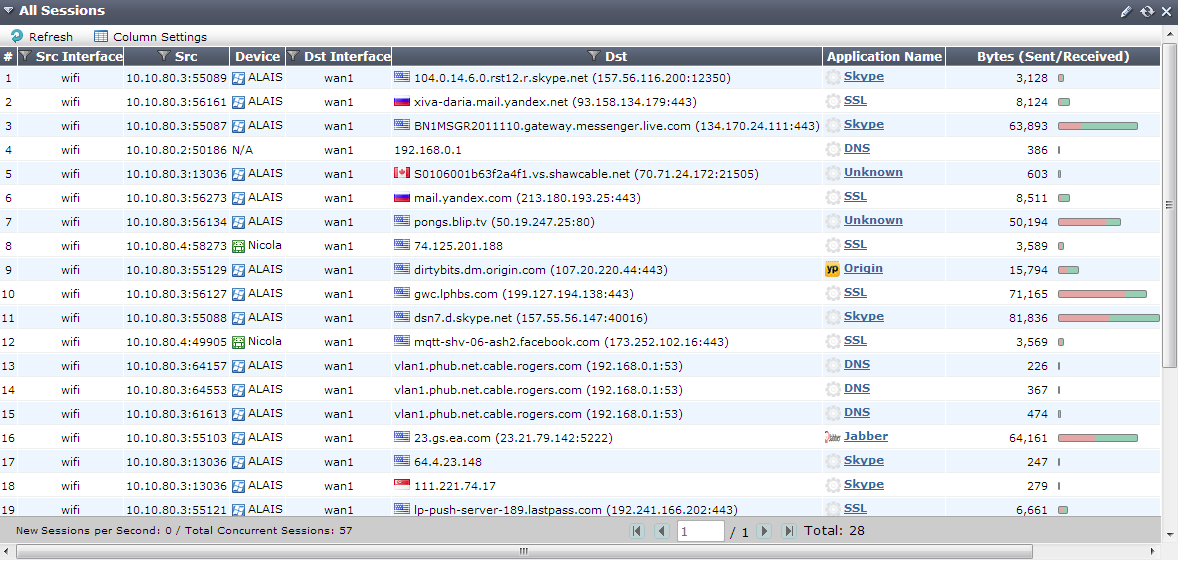
The All Sessions widget shows information on your FortiGate’s traffic. This widget can only be viewed on a dashboard that is set to have a one column display.
FortiView Dashboards
|
|
In order for information to appear in the FortiView dashboards, disk logging must be selected for the FortiGate unit. To select disk logging, go to Log & Report > Log Config > Log Settings. Disk logging is disabled by default for some FortiGate units. To enable disk logging, enter the following command in the CLI: config log disk setting set status enableendPlease note that flash-based logging has been disabled in FortiOS 5.2 for certain models. To view a complete list of affected models, please refer to the Release Notes. |
The FortiView dashboards integrate real time and historical dashboards into a single view. These dashboards can be found by going to Status > FortiView. Each dashboard will initially display the top 100 sessions but when the results are filtered, other sessions may be displayed.
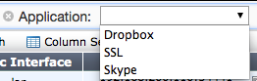
Each dashboards can be filtered by a variety of attributes. Attributes can be selected by using the dropdown menu located at the top of each widgets that displays only the options that have results; for example, if the only applications used in the are Dropbox, SSL, and Skype, the only options in the dropdown menu for the Application filter will be Dropbox, SSL, and Skype.
Filtering for Applications
Results can also be filtered using the various columns, although not all columns support this.
The dashboards also include different time options, allowing you to see current traffic in real-time, or historical traffic that occurred in the last 5 minutes, 1 hour, or 24 hours.
|
|
Historical traffic is only supported on FortiGate models that have local storage. The 24 hours option is also unavailable for desktop models (FortiGate-90 series and below). |
Sources
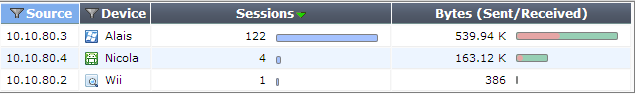
The Sources dashboard shows information about the sources of traffic on your FortiGate unit, including user and device. Additional columns show information about sessions and bytes sent or received.
This dashboard can be filtered by source IP, source device, source interface, destination interface, and policy ID.
The Sources dashboard
Applications
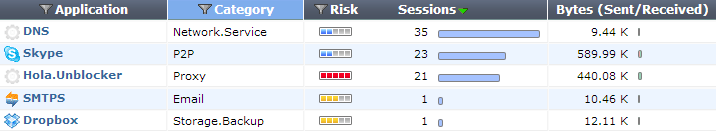
The Applications dashboard shows information about the applications being used on your network, including application name, category, and risk level. Additional columns show information about sessions and bytes sent or received.
This dashboard can be filtered by application, source interface, destination interface, and policy ID.
|
|
In order for information to appear in the Applications dashboard, application control must be enabled in a policy. |
The Applications dashboard
Cloud Applications
The Cloud Applications dashboard shows information about the cloud applications being used on your network, including application name, category, risk level, login IDs, and, if applicable, the number of videos played. If the cursor is held over the column showing the number of videos, the titles of these videos will be shown. Additional columns show information about sessions and bytes sent or received.
Two different views are available for the Cloud Applications dashboard: applications and users. Applications shows a list of the programs being used. Users shows information on the individual users of the cloud applications, including the username if the FortiGate was able to view the login event.
This dashboard can be filtered by application, source interface, destination interface, and policy ID.
|
|
In order for information to appear in the Cloud Applications dashboard, an application control profile that has Deep Inspection of Cloud Applications turned on must be enabled in a policy and SSL Inspection must use deep-inspection. |
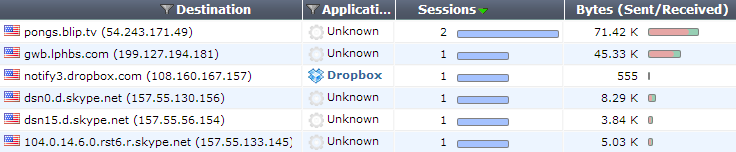
Destinations
The Destinations dashboard shows information about the destination IPs of traffic on your FortiGate unit, as well as the application used. Additional columns show information about sessions and bytes sent or received.
This dashboard can be filtered by destination IP, user, source interface, destination interface, and policy ID.
The Destinations dashboard
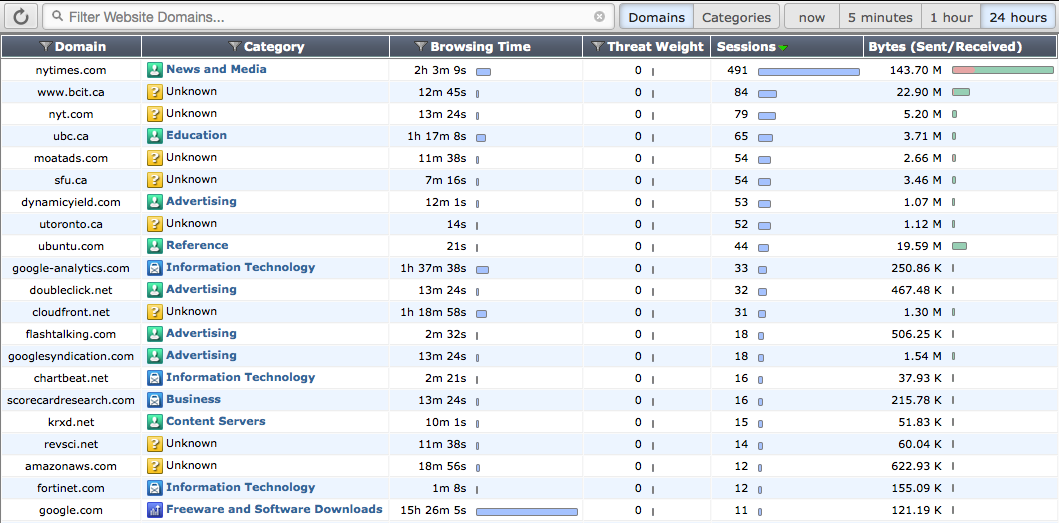
Web Sites
The Web Sites dashboard lists the top allowed and top blocked web sites. You can view information by domain or by FortiGuard categories by using the options in the top right corner. Each FortiGuard category can be clicked on in order to see a description of the category and several example sites, with content loaded from FortiGuard on demand. New icons have also been added for FortiGuard category groups. Additional information is provided about domain, browsing time, threat weight, sources, and bytes sent or received.
This dashboard can be filtered by source interface, domain, destination interface, and policy ID.
|
|
In order for information to appear in the Web Sites dashboard, web filtering must be enabled in a policy, with FortiGuard Categories enabled. |
The Web Sites dashboard
Threats
The Threats dashboard lists the top users involved in incidents, as well as information on the top threats to your network. Additional information is provided about the threat, category, threat level, threat weight, and number of incidents.
This dashboard can be filtered by source interface, threat type, threat, destination interface, and policy ID.
|
|
In order for information to appear in the Threats dashboard, Threat Weight Tracking must be used. |
The Threats dashboard

All Sessions
The All Sessions dashboard shows information about all FortiGate traffic. To choose which columns you wish to view, select Column Settings and place your desired columns in the right-hand box, in the order that you wish them to appear.
This dashboard can be filtered by source IP, destination IP, application, source device, source interface, destination interface, and policy ID. If you have set a filter in a different dashboard before viewing the All Sessions dashboard, that filter will remain until manually cleared.
The All Sessions dashboard
Drilldown Options
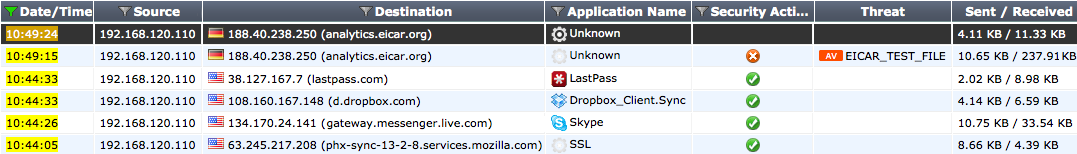
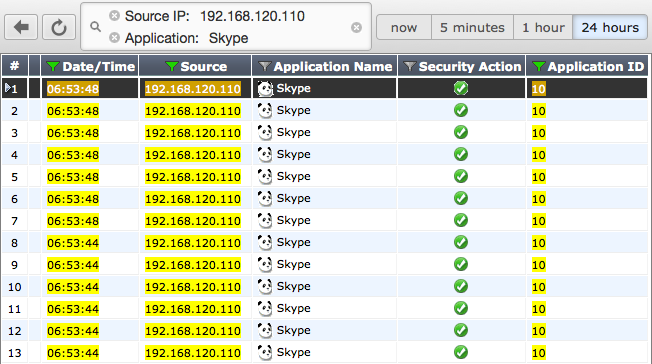
In all FortiView dashboards except for the All Sessions dashboard, you can view more information about a particular session by right-clicking or double-clicking on the session to display the Drilldown to details... option, which opens a summary page that includes further information about applications, sources, destinations, and sessions where applicable.
From this summary page, you can access automatically filtered logs that will show a list of applicable sessions. For example, if you have picked the IP address 192.168.120.110 from the Sources dashboard, you can then select Drilldown to details... for Skype from the Applications column. This will open a log that displays all sessions from 192.168.1.1 that used Skype. From this page, you can select Drilldown to details... for any individual session, in order to view the log entry for that session.
Viewing Skype sessions from the Source Address 192.168.120.110
In the All Sessions dashboard, filters are also used to narrow down what results are shown. If you are viewing historical traffic in the All Sessions dashboard, you can also add an element to a filter by right-clicking the element and selecting Set Filter.
Feature settings
Feature settings are used to disable features which are not required for network administration. Disabling features also removes all related configuration options from the web-based manager.
Some features are disabled by default and must be enabled in order to configure them using the web-based manager.
Enabling/disabling features
Feature Settings can be selected using the Features widget on the Status page, found at System > Dashboard > Status. When viewed in the Status Dashboard, the Features widget only displays a limited number of features. To view the entire list, select the Edit option for the widget.
Feature Settings can also be found at System > Config > Features, where additional features are also available by selecting Show More.
Once you have accessed Feature Settings, ensure all features you wish to use are turned on, while features you wish to hide are turned off. When you have finished, select Apply.
Security Features Presets
The main Security Features can be turned off individually or the five system presets can be used:
- Full UTM should be chosen for networks that require full protection from FortiOS. UTM is the default setting.
- WF should be chosen for networks that require web filtering.
- ATP should be chosen for networks that require protection from viruses and other external threats.
- NGFW should be chosen for networks that require application control and protection from external attacks.
- NGFW + ATP should be chosen for networks that require protection from external threats and attacks.
Information tables
Many of the web-based manager pages contain tables of information that you can filter to display specific information. Administrators with read and write access can define the filters.
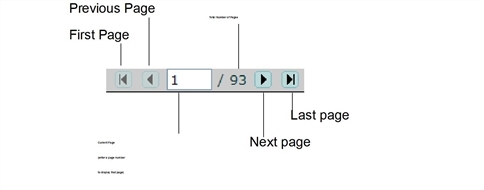
Navigation
Some tables contain information and lists that span multiple pages. At the bottom of the page is the page navigation controls that enables you to move between pages.
Page controls
Adding filters to web‑based manager lists
Filters are used to locate a specific set of information or content within multiple pages. These are especially useful in locating specific log entries. The specific filtering options vary, depending on the type of information in the log.
To create a filter, select Filter Settings or the filter icon in a column heading. When a filter is applied to a column, the filter icon becomes green. Filter settings are stored in the unit’s configuration and will be maintained the next time that you access any list for which you have added filters.
Filtering variables can include: a numeric range (such as 25-50), an IP address or part of an address or any text string combination, including special characters.
Note that the filtering ignores characters following a “<“ unless the followed by a space. For example, the filtering ignores <string but not < string. Filtering also ignores matched opening and closing (< and >) characters and any characters between them. For example, filtering will ignore <string>.
For columns that contain only specific content, such as log message severity, a list of terms is provided from which options can be selected.
Using column settings
Column settings are used to select the types of information which are displayed on a certain page. Some pages have a large amounts of information is available and not all content can be displayed on a single screen. Also, some pages may contain content that is not of use to you. Using column settings, you can display only that content which is important to your requirements.
To configure column settings, right-click the header of a column and select the columns you wish to view and de-select any you wish to hide. After you have finished making your selections, select Apply (you may need to scroll down the list to do so).
Any changes that you make to the column settings of a list are stored in the unit’s configuration and will display the next time that you access the list. To return a page’s columns to their default state, select Reset All Columns, located at the bottom of the Column Settings menu.
Text strings
The configuration of a FortiGate unit is stored in the FortiOS configuration database. To change the configuration, you can use the web-based manager or CLI to add, delete, or change configuration settings. These changes are stored in the database as you make them.
Individual settings in the configuration database can be text strings, numeric values, selections from a list of allowed options, or on/off (enable/disable) settings.
Entering text strings (names)
Text strings are used to name entities in the configuration. For example, the name of a firewall address, administrative user, and so on. You can enter any character in a FortiGate configuration text string except, to prevent Cross-Site Scripting (XSS) vulnerabilities, the following characters:
“ (double quote), & (ampersand), ' (single quote), < (less than) and > (greater than)
Most web-based manager text string fields make it easy to add an acceptable number of characters and prevent you from adding the XSS vulnerability characters.
|
|
There is a different character limitation for VDOM names and hostnames. For both, the only legal characters are numbers (0-9), letters (a-z, A-Z), and special characters - and _. |
From the CLI, you can also use the tree command to view the number of characters that are allowed in a name field. For example, firewall address names can contain up to 64 characters. When you add a firewall address to the web-based manager, you are limited to entering 64 characters in the firewall address name field. From the CLI you can enter the following tree command to confirm that the firewall address name field allows 64 characters.
config firewall address
tree
-- [address] --*name (64)
|- subnet
|- type
|- start-ip
|- end-ip
|- fqdn (256)
|- cache-ttl (0,86400)
|- wildcard
|- comment (64 xss)
|- associated-interface (16)
+- color (0,32)
The tree command output also shows the number of characters allowed for other firewall address name settings. For example, the fully-qualified domain name (fqdn) field can contain up to 256 characters.
Entering numeric values
Numeric values set various sizes, rates, numeric addresses, and other numeric values. For example, a static routing priority of 10, a port number of 8080, or an IP address of 10.10.10.1. Numeric values can be entered as a series of digits without spaces or commas (for example, 10 or 64400), in dotted decimal format (for example the IP address 10.10.10.1) or, as in the case of MAC or IPv6 addresses, separated by colons (for example, the MAC address 00:09:0F:B7:37:00). Most numeric values are standard base-10 numbers, but some fields (again, such as MAC addresses) require hexadecimal numbers.
Most web-based manager numeric value fields make it easy to add the acceptable number of digits within the allowed range. CLI help includes information about allowed numeric value ranges. Both the web-based manager and the CLI prevent you from entering invalid numbers.
Copyright © 2018 Fortinet, Inc. All Rights Reserved. | Terms of Service | Privacy Policy