
FortiView interface
FortiView lets you access information about the traffic activity on your FortiGate, visually and textually. FortiView is broken up into several consoles, each of which features a top menu bar and a graph window, as seen in the following image:
FortiView Application console sorted by Sessions (Blocked/Allowed)
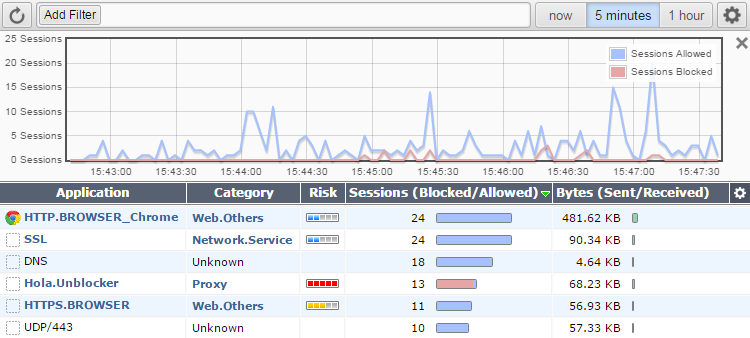
The top menu bar features a Refresh button, which updates the data displayed, a Filter button for filtering the data by category, Time Display options (now, 5 minutes, 1 hour, or 24 hours), and a Settings button (containing additional viewing settings and a link to the Threat Weight menu).
The graph window can be hidden using the X in the top right corner, and re-added by selecting Show Graph. To zoom in on a particular section of the graph, click and drag from one end of the desired section to the other. This will appear in the Time Display options as a Custom selection. The minimum selection size is 60 seconds.
|
|
Only FortiGate models 100D and above support the 24 hour historical data. |
Copyright © 2018 Fortinet, Inc. All Rights Reserved. | Terms of Service | Privacy Policy