Figure 32: FortiManager system dashboard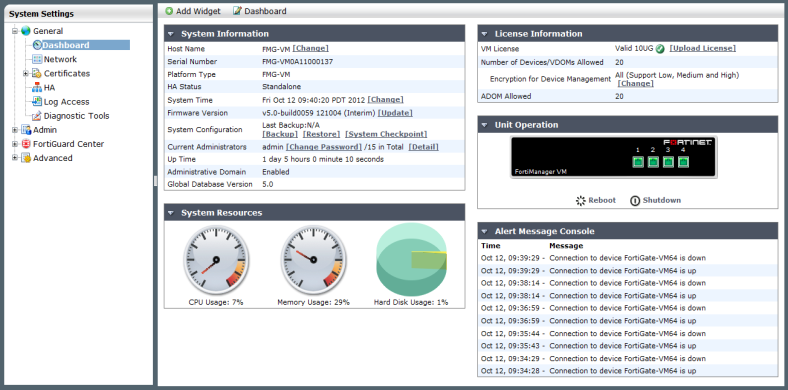
System Information | Displays basic information about the FortiManager system, such as up time and firmware version. For more information, see “General settings”. From this widget you can also manually update the FortiManager firmware to a different release. For more information, see “Firmware images”. |
License Information | Displays the devices being managed by the FortiManager unit and the maximum numbers of devices allowed. For more information, see “License Information widget”. |
Unit Operation | Displays status and connection information for the ports of the FortiManager unit. It also enables you to shutdown and restart the FortiManager unit or reformat a hard disk. For more information, see “Unit Operation widget”. |
System Resources | Displays the real-time and historical usage status of the CPU, memory and hard disk. For more information, see “System Resource widget”. |
Alert Message Console | Displays log-based alert messages for both the Fortinet unit itself and connected devices. For more information, see “Alert Messages Console widget”. |
CLI Console | Opens a terminal window that enables you to configure the FortiManager unit using CLI commands directly from the Web-based Manager. This widget is hidden by default. For more information, see “CLI Console widget”. |
RAID Monitor | Displays information about the status of RAID disks as well as what RAID level has been selected. It also displays how much disk space is currently consumed. For more information, see “RAID Monitor widget”. |