System Resource widget
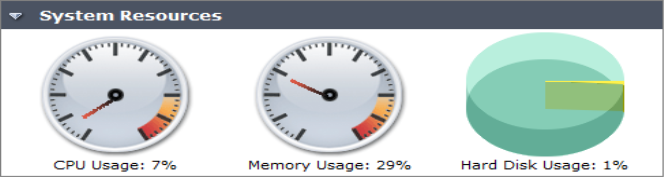
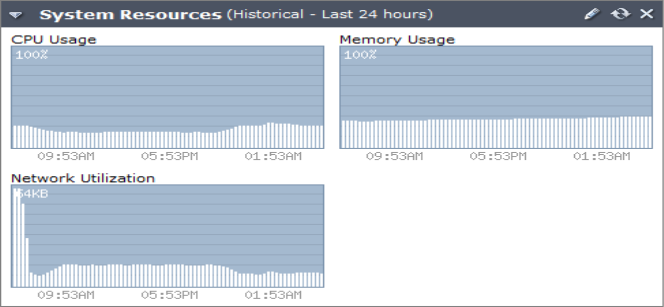
The System Resources widget on the dashboard displays the usage status of the CPU, memory and hard disk. You can view system resource information in both real-time and historical format.
CPU Usage | The current CPU utilization. The Web-based Manager displays CPU usage for core processes only. CPU usage for management processes (for example, for HTTPS connections to the Web-based Manager) is excluded. |
Memory Usage | The current memory utilization. The Web-based Manager displays memory usage for core processes only. Memory usage for management processes (for example, for HTTPS connections to the web‑based manager) is excluded. |
Hard Disk Usage | The current hard disk usage, shown on a pie chart as a percentage of total hard disk space. This item does not appear when viewing historical system resources. |
Network Utilization | The network utilization over the specified historical time period. This item does not appear when viewing current (Real Time) system resources. |
Change the system resource widget display settings:
1. Go to System Settings > General > Dashboard.
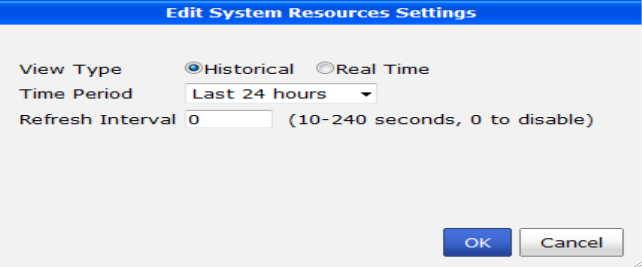
2. In the System Resources widget, hover the mouse over the title bar and select the Edit icon. The Edit System Resources Settings dialog box appears.
3. You can configure the following settings:
• To view only the most current information about system resources, from View Type, select Real Time. This is the default.
• To view historical information about system resources, from View Type, select History. To change the time range, from Time Period, select one of the following: Last 10 minutes, Last 1 hour, or Last 24 hours.
• To automatically refresh the widget at intervals, in Refresh Interval, type a number between 10 and 240 seconds. To disable the refresh interval feature, type 0.
4. Select OK to apply your settings.