Viewing web site statistics
Log&Report > Monitor > Data Analytics displays statistics on traffic from clients internationally, web page hits, and attacks. Clients’ locations are determined by source IP address, which is then mapped to its current known location:
• A country/region, state, and city — Public IP addresses that are known to belong to routers in a specific physical location.
• Undetermined City/State — An IP address where the exact city and/or state could not be determined. This appears when zooming in to view a country. An IP with an undetermined city/state can occur if complete, precise location data is not available, or perhaps if the IP address belongs to multiple regions such as can occur in border regions.
• Internal IPs — 10.*, 172.16.*, or 192.168.* addresses that are reserved for private networks according to RFC 1918, and therefore might be located anywhere on the planet.
| To make sure that the mappings are correct, you should periodically update FortiWeb’s geography-to-IP mappings. See “Updating data analytics definitions”. If all client IP addresses appear to originate on private networks (“Internal IPs”) and especially from a single IP, SNAT may be interfering and you may need to configure FortiWeb to deduce the client’s location using X-headers instead. See “Defining your proxies, clients, & X-headers”. |
To access this part of the web UI, your administrator’s account access profile must have
Read and
Write permission to items in the
Log & Report category. For details, see
“Permissions”.
| The data analytics feature can be resource-intensive. To avoid impacting performance, view the data analytics report in off-peak hours. |
Data analytics organizes the data collected by server policies into two distinct cross-sections. Click the buttons on the top right corner to toggle between:
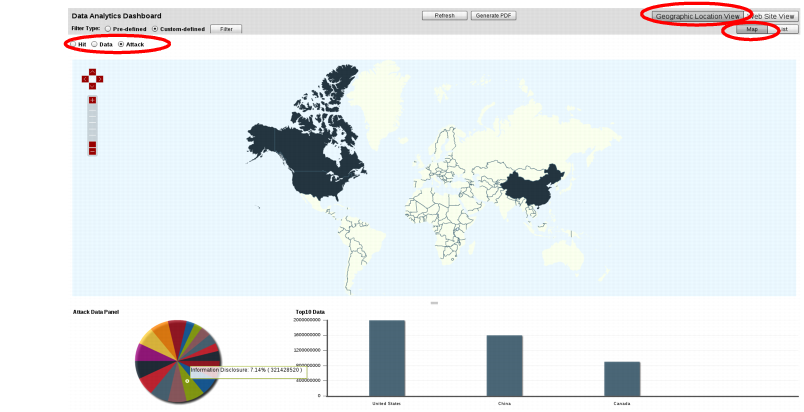
• Geographic Location View — Displays data per clients’ geographical location (e.g. Canada, China, Portugal, Morocco, Brazil, Australia, etc.) in graphical format.
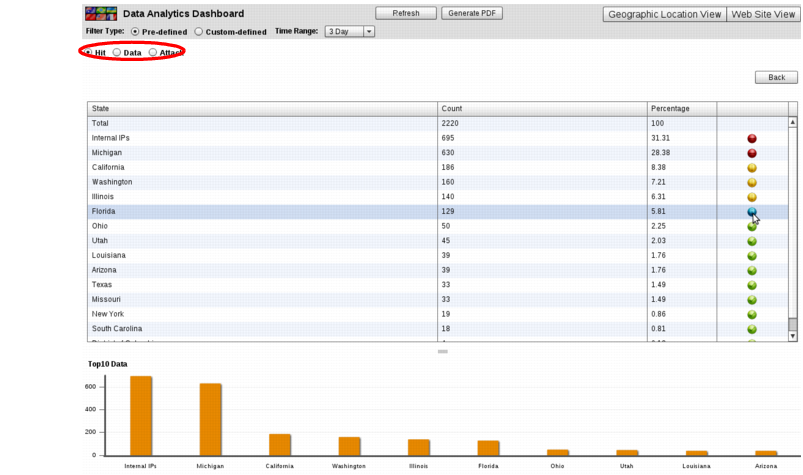
While this view is selected, a format toggle appears below the view toggle. The format toggle allows you to choose what will accompany the data analytics charts: either List (for a table of statistics by country) or Map (for a map of the Earth). To display the statistics for a country/region, hover your mouse cursor over it. The statistics will appear in a tool tip.
If you click a specific country/region on the map of the Earth, the map will zoom in to show the states within that area. Similar to the view of the entire Earth, to display statistics for a sub-region, hover your mouse cursor over it. The statistics appear in a tool tip.
Select either:
• Hit — Display the number of legitimate page hits, and percentage of total requests, originating from each country.
In the unlabeled column to the right of the Percentage column, icons indicate the range of percentage by color-coded dots:
Red — Greater than 12%
Orange — 9% - 12%
Yellow — 6% - 9%
Blue — 3% - 6%
Green — 0% - 3%
• Data — Display the traffic volume in bytes, and percentage of total requests, originating from country.
• Attack — Display the attack count, and percentage of total requests, originating from each country.
| Geographic location is based upon the apparent origin according to the source IP address of the request. Accuracy may vary due to network address translation (NAT) and/or clients’ use of proxies such as Tor and IPSec, SSH, or other VPN tunnels which alter the source IP address in packets and therefore can cause clients’ traffic to appear to originate from a location other than their actual location. |
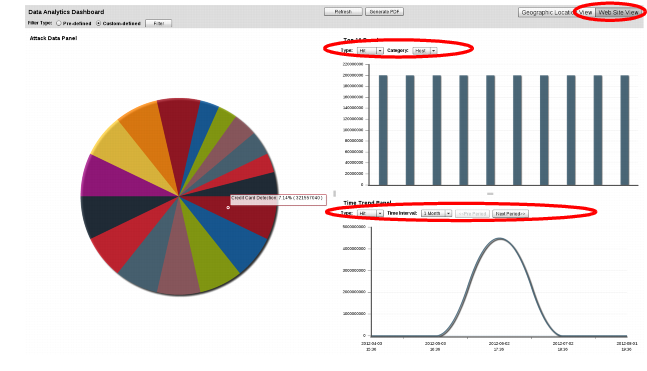
• Web Site View — Displays data about the popular URLs and commonly attempted attacks on your web sites in graphical format. The page includes a pie chart (if there is data available) and two panels with bar graphs.
From the Type drop-down lists, select either:
• Hit — Display the top 10 countries of origin for legitimate page hits.
• Data — Display the top 10 countries of origin for traffic volume.
• Attack — Display the top 10 countries of origin for attacks.
In the Top 10 Panel, from the Category drop-down list, select either:
• Host — Display the top 10 domain names by hits, attacks, or traffic volume (depending on your selection in Type).
• URL — Display the top 10 URLs by hits, attacks, or traffic volume (depending on your selection in Type).
In the Time Trend Panel, from the Time Interval drop-down list, select a time interval (e.g. 1 Week), then click the Pre Period (previous) and Next Period buttons to advance by that interval through the time span that you have selected in either Time Range or your custom data filter.
For example, if Type is Attack and Category is Host, the panel displays the 10 domains that received the most attack attempts. Let’s say that a trend of attacking www.example.com is consistent over time. (You could confirm this suspicion in the Time Trend Panel.) This could represent either an advanced persistent threat (APT) — an attacker that is an adversary of that specific organization, and likely to continue and attempt more evolved threats until she or he discovers a viable exploit — or it could simply be an attack attempt because security-wise, that specific web server is an easy target. Attacks on weak hosts might be discouraged by applying patches, cloaking the web server, configuring sever protection rules on FortiWeb to mitigate the host’s weaknesses, etc. An APT however, indicates a collectively greater risk than a lone attack attempt against a weak host, and will likely continue regardless of increasing attack difficulty. If you determine that the attacker(s) is an APT, you might decide to devote more resources to protecting that web server, including a full web application source code and security practice audit, as well as configuring anti-defacement.
Both cross-sections have common controls:
• Click Refresh to re-populate the graphs with the most recent data. (The web UI displays data current at the time of the most recent refresh or page load. It does not continuously update.)
• Click Generate PDF to download a PDF copy of the current statistics.
• Select either:
• Pre-defined — Choose a time span from the Time Range drop-down list to view its statistics.
See also
Filtering the data analytics report
By default, in Filter Type, the Pre-defined option is selected, and so the data analytics reports include statistics based solely upon one of a few pre-defined time periods, which you can select from Time Range.
However, you can define your own time span, as well as filter statistics based upon criteria other than time.
To create a custom statistical filter
1. Go to Log&Report > Monitor > Data Analytics.
To access this part of the web UI, your administrator’s account access profile must have
Read and
Write permission to items in the
Log & Report category. For details, see
“Permissions”.
2. Select the view to use: Web Site View or Geographic Location View.
3. From Filter Type, select the Custom-defined option.
4. Click Filter.
A dialog appears.
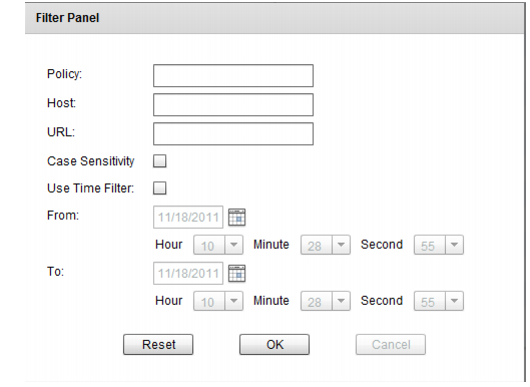
5. Configure the following criteria, if any, that a statistic must match in order to be included in the report:
Setting name | Description |
Policy | Type the name of a server policy that is gathering data for data analytics. It must use a profile where you have enabled Data Analytics. Otherwise, it will not include any statistics. |
Host | Type a domain name or IP address in the Host: field of the HTTP header of requests. |
URL | Type a URL. It usually should be a web page that initiates a session. (Session-initiating URL hit counts may more closely correlate to visit counts. For example, web application preference pages are seldom visited in a session.) |
Case Sensitivity | Enable to differentiate uniform resource locators (URLs) and Host: HTTP header fields according to upper case and lower case letters. For example, when this option is enabled, an HTTP request involving http://www.Example.com/index would not match if Host is www.example.com and URL is /index (difference is lower case "e"). |
Use Time Filter | Enable to use only statistics within a specific time period, defined by From and To. |
| From | Click the calendar icon or its accompanying text field to define the date at the beginning of the time period, then select the Hour, Minute, and Second to define the time of day. |
| To | Click the calendar icon or its accompanying text field to define the date at the end of the time period, then select the Hour, Minute, and Second to define the time of day. |
6. Click OK.
The page refreshes and displays data restricted by the new filter. The filter applies until you either:
• In Filter Type, choose Pre-defined, then select a predefined Time Range.
• Clear the filter by clicking the Filter button to raise the dialog again, click Reset, then click OK.
See also