Table 56: Log&Report > Log Access > Event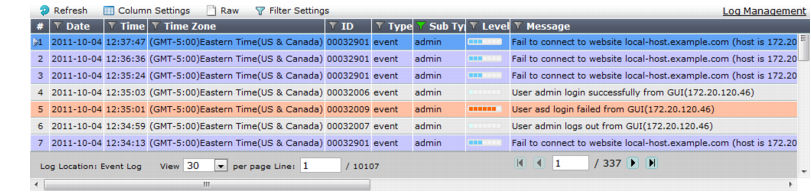
Storage method | Log type | ||
Event | Traffic | Attack | |
Local disk | Yes | Yes | Yes |
Local memory | Yes | No | No |
Syslog server | Yes | Yes | Yes |
FortiAnalyzer | Yes | Yes | Yes |
ArcSight (SIEM) | Yes | Yes | Yes |
In FortiWeb HA clusters, log messages are recorded on their originating appliance. If you notice a gap in the logs, a failover may have occurred. Logs during that period will be stored on the other appliance. To view those logs, switch to the other appliance. |
Button | Description |
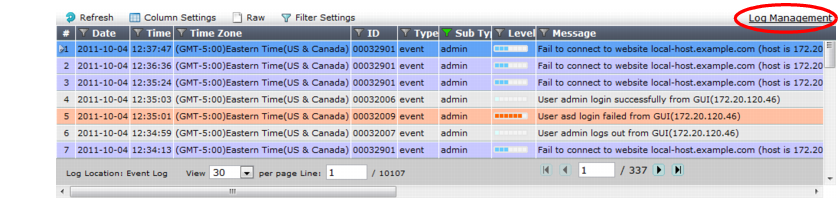
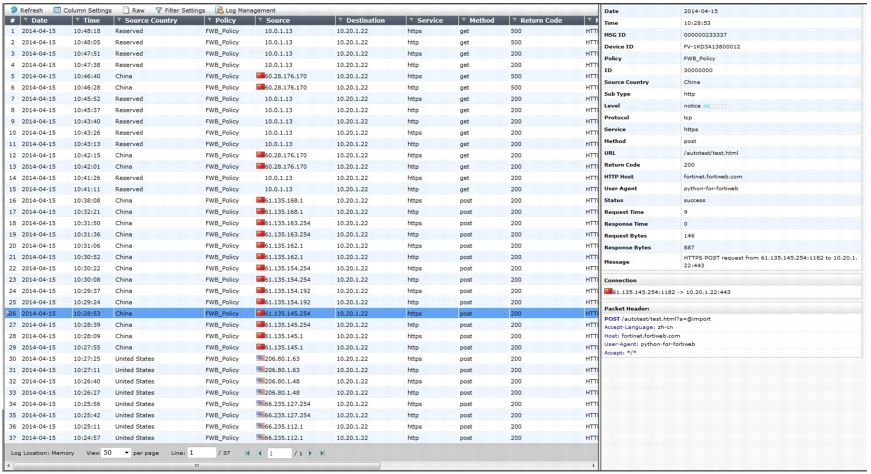
Refresh | Click to update the page with any logs that have been recorded since you previously loaded the page. |
Column Settings | Click to display or hide the columns that correspond to log fields, or change the order in which they appear on the page. For more information, see “Displaying & arranging log columns”. |
Raw or Formatted | Click to toggle between a Raw and Formatted view of the log information. The raw view displays the log message as it actually appears in the log file. The formatted view displays the log message in a columnar format. Click to switch the log information view to that opposite of what is currently displayed. For details on both view types, see “Switching between Raw & Formatted log views”. |
Clear All Filters | Click this icon to clear all log view filters. For details on log view filters, see “Filtering log messages”. |
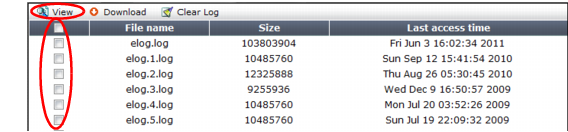
Log Management | Click to download, delete, or view the contents of a log file. |
Button | Description |
Refresh | Click to update the page with any logs that have been recorded since you previously loaded the page. |
Column Settings | Click this icon to display or hide the columns that correspond to log fields, or change the order in which they appear on the page. For more information, see “Displaying & arranging log columns”. |
Raw or Formatted | Click to toggle between a Raw and Formatted view of the log information. The raw view displays the log message as it actually appears in the log file. The formatted view displays the log message in a columnar format. Click to switch the log information view to that opposite of what is currently displayed. For details on both view types, see “Switching between Raw & Formatted log views”. |
Clear All Filters | Click this icon to clear all log view filters. For details on log view filters, see “Filtering log messages”. |
Log Message Aggregation | Click to arrange the attack logs into specific categories. For more information, see “Coalescing similar attack log messages”. |
Log Search | Click to search attack logs using simple or advanced search criteria. For more information, see “Searching attack logs”. |
Log Management | Click to download, delete, or view the contents of a log file. |
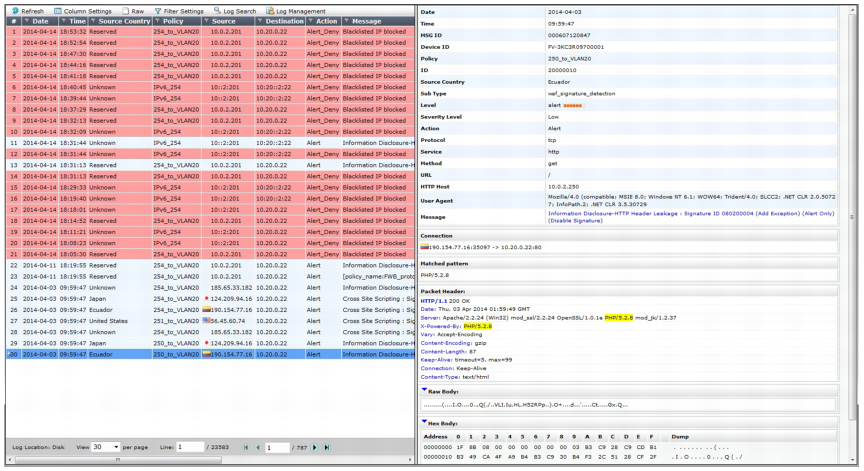
Not all detected attacks may be blocked, redirected, or sanitized. For example, while using auto-learning, you can configure protection profiles with an action of Alert (log but not deny), allowing the connection to complete in order to gather full auto-learning data. To determine whether or not an attack attempt was permitted to reach a web server, show the Action column. For details, see “Displaying & arranging log columns”. Additionally, if the FortiWeb appliance is operating in offline protection mode or transparent inspection mode, due to asynchronous inspection where the attack may have reached the server before it was detected by FortiWeb, you should also examine the server itself. |
Button | Description |
Refresh | Click to update the page with any logs that have been recorded since you previously loaded the page. |
Column Settings | Click to display or hide the columns that correspond to log fields, or change the order in which they appear on the page. For more information, see “Displaying & arranging log columns”. |
Raw or Formatted | Click to toggle between a Raw and Formatted view of the log information. The raw view displays the log message as it actually appears in the log file. The formatted view displays the log message in a columnar format. Click to switch the log information view to that opposite of what is currently displayed. For details on both view types, see “Switching between Raw & Formatted log views”. |
Clear All Filters | Click this icon to clear all log view filters. For details on log view filters, see “Filtering log messages”. |
Log Management | Click to download, delete, or view the contents of a log file. |