Status dashboard
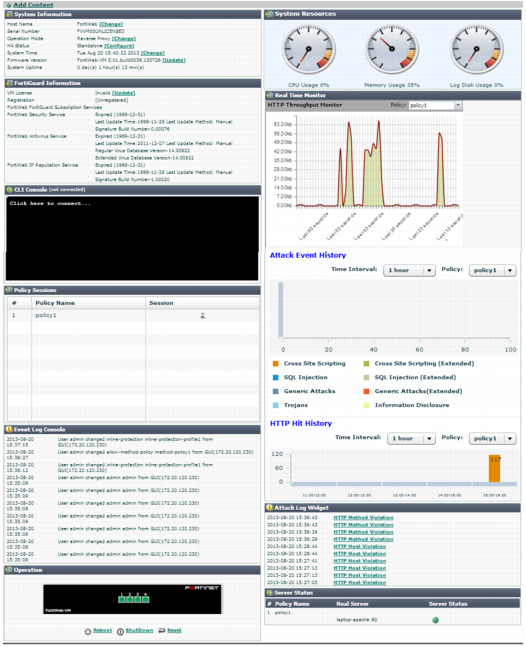
System > Status > Status appears when you log in to the web UI. It contains a dashboard with widgets that each indicate performance level or other system statuses.
Each day, check the dashboard for obvious problems.
By default, the Status dashboard contains the following widgets:
FortiWeb provides a separate dashboard that displays the status of policies and the server pools they are associated with. See
“Policy Status dashboard”.
In the default dashboard setup, widgets display the serial number and current system status of the FortiWeb appliance, including uptime, system resource usage, host name, firmware version, system time, and status of policy sessions. The dashboard also contains a CLI widget that enables you to use the command line interface (CLI) through the web UI.
To customize the dashboard, select which widgets to display, where they are located on the page, and whether they are minimized or maximized.
To move a widget, position your mouse cursor on the widget’s title bar, then click and drag the widget to its new location.
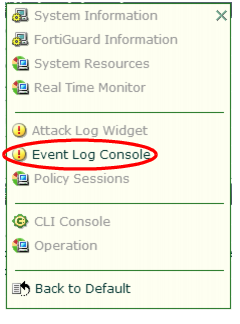
To display any of the widgets not currently shown on System > Status > Status, click Add Content. Any widgets currently already displayed on System > Status > Status are grayed out in the Add Content menu, as you can only have one of each display on the page.
To display the default set of widgets on the dashboard, select Back to Default.
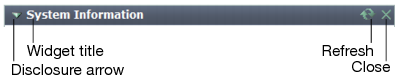
To see the available options for a widget, position your mouse cursor over the icons in the widget’s title bar. Options vary slightly from widget to widget, but always include options to close, minimize or maximize the widget.
Button/field | Description |
Widget Title | The name of the widget. |
Disclosure arrow | Click to maximize or minimize the widget. This arrow replaces the widget’s icon when you place your mouse cursor over the title bar. |
Edit | The CLI Console widget title bar includes an Edit icon. Click it to change settings for the widget. |
Refresh | Click to update the displayed information. This option does not appear on the CLI Console widget. |
Close | Click to close the widget on the dashboard. You will be prompted to confirm the action. To show the widget again, click Add Content near the top of the page. |
To access the dashboard, your administrator's account access profile must have
Read permission to items in the
System Configuration category. To use features that alter the FortiWeb or perform actions, you may also need
Write permissions in various categories. For details, see
“Permissions”.