System Resources widget
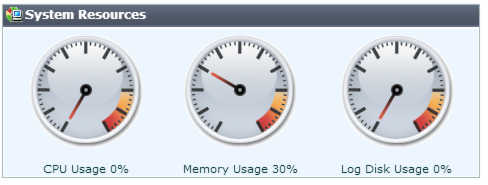
The System Resources widget on the dashboard displays CPU usage, memory usage,, and data disk usage.
| The widget displays CPU and memory usage as a dial gauge and as a percentage of the usage for core processes only. CPU and memory usage for management processes (for example, for HTTPS connections to the web UI) is excluded. |
Normal idle load varies by hardware platform, firmware, and configured features. To determine your specific baseline for idle, configure your system completely, reboot, then view the system load. After at least 1 week of uptime with typical traffic volume, view the system load again to determine the normal non-idle baseline.
To determine your available disk space, you can alternatively connect to the CLI and enter the command:
diagnose system mount list