Real Time Monitor widget
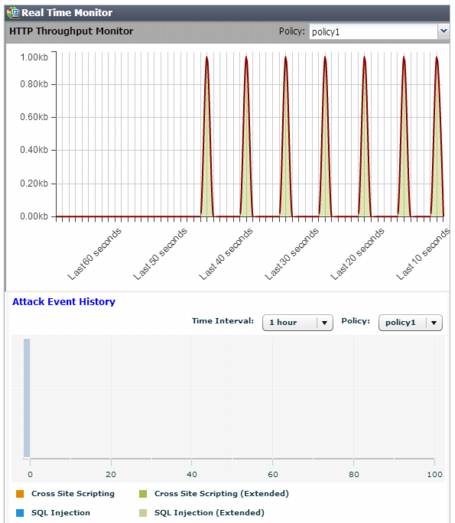
The Real Time Monitor widget on the dashboard displays three graphs.
• HTTP Traffic Monitor — Displays the traffic volume throughput during each time period.
• Attack Event History — Displays the number of each type of common exploit, SQL injection, cross-site scripting (XSS), or information disclosure attacks that were prevented.
• HTTP Hit History — Displays the total number of page requests.
For each graph, you can select which policy’s statistics to view and the size of the interval (Rate threshold or Time interval) represented by each appliance on the graph.
By positioning your cursor over a point in the graph, you can display information for that point in time, such as (for HTTP Traffic Monitor) the traffic volume at that point in time.
See also