Figure 28: FortiAnalyzer system settings dashboard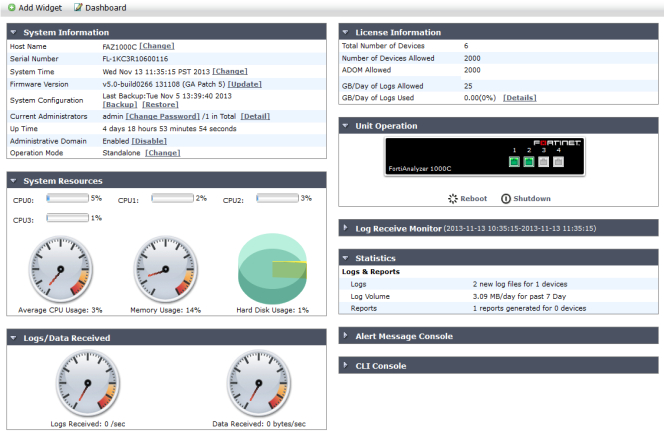
System Information | Displays and allow editing of some basic information about the FortiAnalyzer system, including host name, serial number, platform type, system time, firmware version, system configuration, current administrators, up time, administrative domains, and operation mode. From this widget you can manually update the FortiAnalyzer firmware to a different release. For more information, see “System Information widget”. |
License Information | Displays the devices being managed by the FortiAnalyzer unit, the maximum numbers of devices allowed, the maximum number of ADOMs allowed, GB/Day of logs allowed, and GB/Day of logs used. FortiAnalyzer VM also includes device quota allowed, device quota used, and management IP address fields. For more information, see “License Information widget”. |
Unit Operation | Displays status and connection information for the ports of the FortiAnalyzer unit. It also enables you to shutdown and reboot the FortiAnalyzer unit. For more information, see “Unit Operation widget”. |
System Resources | Displays the real-time and historical usage status of the CPU, memory and hard disk. For more information, see “System Resources widget”. |
Alert Message Console | Displays log-based alert messages for both the FortiAnalyzer unit itself and connected devices. For more information, see “Alert Messages Console widget”. |
CLI Console | Opens a terminal window that enables you to configure the FortiAnalyzer unit using CLI commands directly from the Web-based Manager. For more information, see “CLI Console widget”. |
Statistics | Displays statistics for logs and reports since last reset. For more information, see “Statistics widget”. |
Logs/Data Received | Displays the real-time or historical usage status of logs received and data received. For more information, see “Logs/Data Received widget”. |
Log Receive Monitor | Displays a real-time graph of logs received. You can select to view data per device or per log type. For more information, see “Log Receive Monitor widget”. |