Figure 47: Logs/data received widget (real-time)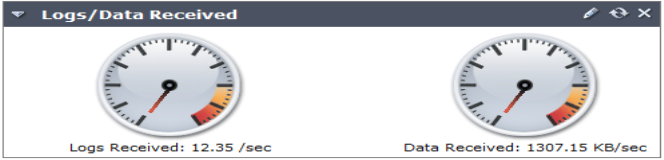
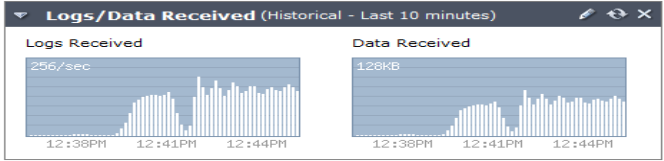
Logs Received | Number of logs received per second. | |
Data Received | Volume of data received. | |
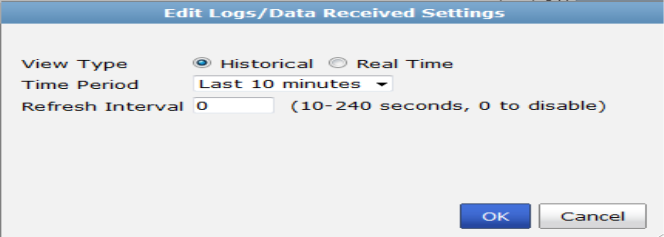
View Type | Select Real Time to view current information about system resources. Select Historical to view historical information. |
Time Period | Select one of the following time ranges: Last 10 Minutes, Last 1 Hour, or Last 24 Hours. |
Refresh Interval | Automatically refresh the widget. Enter a number between 10 and 240 seconds. To disable automatic refresh, enter 0. |