Viewing RTM data
After creating an RTM profile, and adding dashboards and charts to it, the real-time data can be viewed in the device summaries of the devices to which the RTM profile was assigned.
To view the RTM data:
1. In the Device Manager tab, select the ADOM or group to which the device whose data you would like to view belongs.
2. From the device list in the content pane, select the desired device.
The selected device’s dashboard will be shown in the lower content pane. See
“View managed devices” for more information.
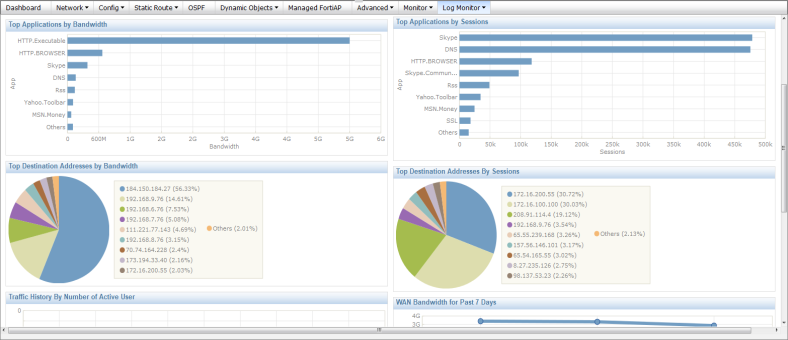
3. In the dashboard tool bar, select Log Monitor, generally on the far right side of the tool bar.
4. Select the RTM profile dashboard that you would like to view from the drop-down list.
The charts specified in the RTM profile dashboard will be populated with data and shown in the device summary pane.
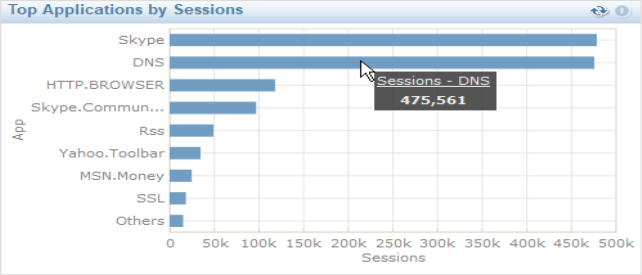
5. To view more detail on specific data within one of the charts, hover your cursor over a portion of the graph and a small dialog box will pop-up showing more data.
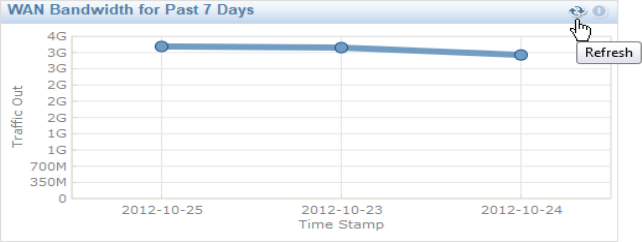
6. To refresh the data in a chart, select the Refresh button in the right corner of the chart title bar.
7. To make any changes to the layout of the charts, or to add or remove charts, return to the RTM Profile tab. For information see
“RTM profiles”,
“Dashboards”, and
“Charts”.