Dashboards
Each RTM profile can contain multiple dashboards. A dashboard contains the charts that represent the information that will be presented in the device summary.
Each dashboard in a profile can be selected from the Log Monitor tab on the device summary tool bar. See
“View managed devices” for more information.
Dashboards can be created, edited, and deleted.
To create a new dashboard:
1. On the RTM Profiles tab, select the +, or Add Dashboard, icon in the content pane tool bar.
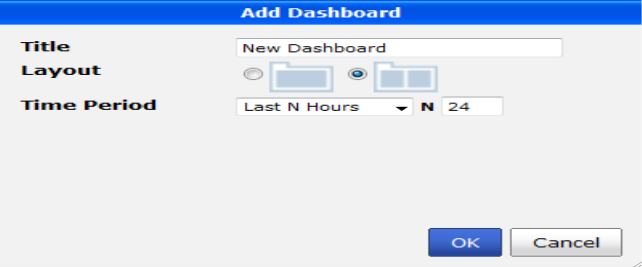
The Add Dashboard dialog box will open
2. Enter a name for the new dashboard in the Title field, select the number of columns the dashboard will contain (one or two) and enter the time period that the data in the charts will cover in the Time Period field.
The available time periods are:
Last N Hours | Last N Days | Last Month |
Today | This Week | This Quater |
Yesterday | Last Week | Last Quarter |
Last 7 Days | Last 2 Weeks | This Year |
Last 14 Days | Last N Weeks | Other |
Last 30 Days | This Month | |
Where N represents a variable, allowing for a user selectable number of hours, days, or weeks.
If Other is selected, the start and end date and time must be manually entered.
3. Select OK to create the new dashboard.
The new dashboard will appear on the content pane tool bar to the right of any previsouly created dashboards in that profile.
To edit a dashboard:
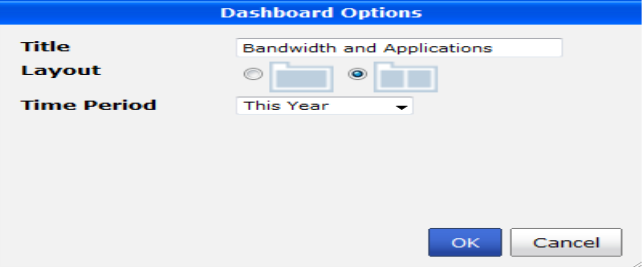
1. On the RTM Profiles tab, select the dashboard you would like to edit, and then select Options.
The Dashboard Options dialog box will open
2. Edit the dashboard information as required, then select OK to finish editing the dashboard.
To delete a dashboard:
1. On the RTM Profiles tab, select the X, or Delete, icon to the right of the in dasboard name for the dashboard that you would like to delete.
2. Select OK in the confirmation box to delete the dashboard and all of its data.