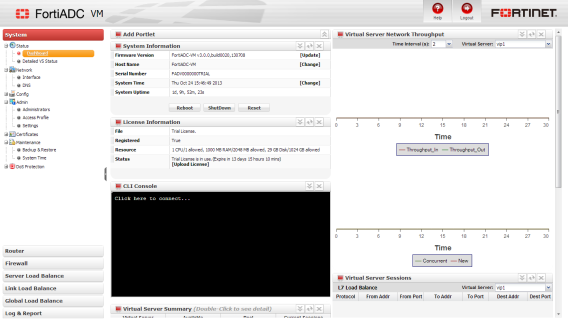
The dashboard
System > Status > Dashboard appears when you log in to the web UI. It contains a dashboard with widgets that each indicate performance level or other system statuses.
Each day, check the dashboard for obvious problems.
By default, the dashboard contains the following widgets:
In the default dashboard setup, widgets display the serial number and current system status of the FortiADC appliance, including uptime, system resource usage, event log messages, host name, firmware version, system time, and status of virtual servers and their IP sessions. The dashboard also contains a CLI widget that enables you to use the command line interface (CLI) through the web UI.
To customize the dashboard, select which widgets to display, where they are located on the page, and whether they are minimized or maximized.
To move a widget, position your mouse cursor on the widget’s title bar, then click and drag the widget to its new location.
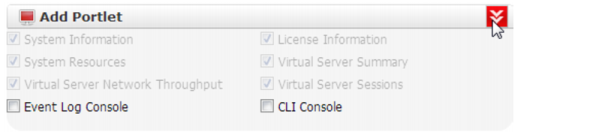
To display any of the widgets not currently shown on System > Status > Dashboard, click Add Portlet. Any widgets currently already displayed on System > Status > Dashboard will be grayed out in the Add Portlet menu, as you can only have one of each display on the page.
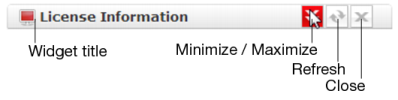
The widget’s title bar contains buttons to close, minimize or maximize the widget.
To access the dashboard, your account access profile must have
Read permission to items in the
System category. To use features that alter the FortiADC or perform actions, you may also need
Write permissions in various categories. For details, see
“Permissions”.