Figure 21: RAID monitor displaying a RAID array without any failures 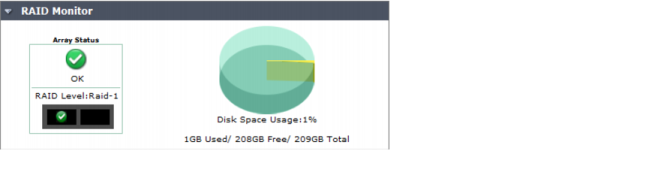
Array Status | Icons and text indicating the RAID level and one of the following RAID disk statuses: • green checkmark (OK): Indicates that the RAID disk has no problems • warning symbol (Warning): Indicates that there is a problem with the RAID disk, such as a failure, and needs replacing. The RAID disk is also in reduced reliability mode when this status is indicated in the widget. • wrench symbol (Rebuilding): Indicates that a drive has been replaced and the RAID array is being rebuilt; it is also in reduced reliability mode. • exclamation mark (Failure): Indicates that one or more drives have failed, the RAID array is corrupted, and the drive must be re-initialized. This is displayed by both a warning symbol and text. The text appears when you hover your mouse over the warning symbol; the text also indicates the amount of space in GB. | |
Rebuild Status | A percentage bar indicating the progress of the rebuilding of a RAID array. The bar displays only when a RAID array is being rebuilt. | |
Estimated rebuild time [start and end time] | The time remaining to rebuild the RAID array, and the date and time the rebuild is expected to end. This time period displays only when an array is being rebuilt. This time period will not display in hardware RAID, such as FMG-2000, FMG-2000A, FMG-2000B, FMG-4000, FMG-4000A, FMG-4000B. | |
Rebuild Warning | Text reminding you the system has no redundancy protection until the rebuilding process is complete. This text displays only when an array is being rebuilt. | |
Disk space usage | The amount of disk used, displayed as a percentage and a percentage pie chart, and listing the number of GB used, free, and in total. Note that the FortiManager unit reserves some disk space for compression files, upload files, and temporary reports files. The total reserved space is: • 25% of total disk space if total < 500G, with MAX at 100G • 20% of total disk space if 500G< total <1000G, with MAX at 150G • 15% of total disk space if 1000G < total < 3000G, with MAX at 300G • 10% of total disk space if total > 3000G This is therefore to be deducted from the total capacity. | |