Figure 89: Remote logging configuration page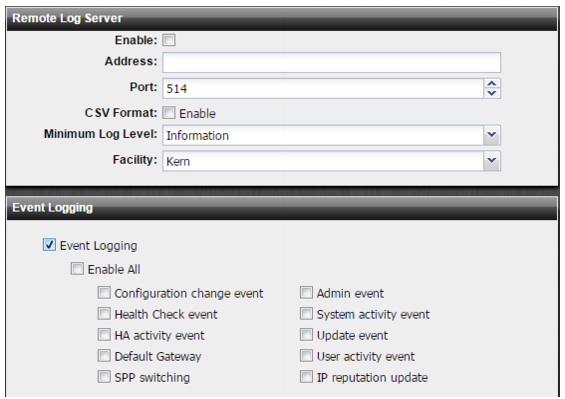
Settings | Guidelines |
Enable | Select to display settings to manage the disk used for logging. |
Address | IP address of the FortiAnalyzer or syslog server. |
Port | Listening port number of the FortiAnalyzer/syslog server. Usually this is UDP port 514. |
CSV Format | Send logs in CSV format. Do not use with FortiAnalyzer. |
Minimum Log Level | Select the lowest severity to log from the following choices: • Emergency—The system has become unstable. • Alert—Immediate action is required. • Critical—Functionality is affected. • Error—An error condition exists and functionality could be affected. • Warning—Functionality might be affected. • Notification—Information about normal events. • Information—General information about system operations. • Debug—Detailed information about the system that can be used to troubleshoot unexpected behavior. For example, if you select Error, the system sends the syslog server logs with level Error, Critical, Alert, and Emergency. If you select Alert, the system collects logs with level Alert and Emergency. |
Facility | Identifier that is not used by any other device on your network when sending logs to FortiAnalyzer/syslog. |
Event Logging | Select to enable event logging and then select the types of events that you want included in the event log. |
Field | Example |
Syslog device ID | device_id=SYSLOG-AC1E997F |
Syslog type | type=generic |
Syslog log level | pri=information |
Syslog time | itime=1431633173 |
Log datestamp | date=2015-05-13 |
Log timestamp | 13:25:13 |
Log time zone | tz=PDT |
Device ID | devid=FI800B3913000032 |
Log ID | log_id=0000002168 |
Log type | type=event |
Log subtype | subtype=config |
Log level | level=information |
Message ID | msg_id=426204 |
Admin user | user=admin |
Admin UI | ui=ssh(172.30.153.9) |
Action | action=none |
Status | status=none |
Reason string | reason=none |
Log message | msg='changed settings for 'ddos spp setting' on domain 'SPP-1''" |