Viewing auto-learning reports
Auto Learn > Auto Learn Report > Auto Learn Report displays the list of reports that the FortiWeb appliance has automatically generated from information gathered by auto-learning profiles.
Primarily, you use auto-learning reports to determine whether or not the auto-learning feature has collected sufficient data to end the auto-learning phase of your installation, and transition to purely applying your security policies (see Generating a profile from auto-learning data).

|
Sometimes, such as when you change the web applications that are installed on your web servers, you may want to run additional phases of auto-learning.
To create a fresh auto-learning report, new protection profiles, or both, you can reset the auto-learning report and delete its data. For details, see Removing old auto-learning data.
|
Reports from auto-learning profile data can also provide information about your web servers’ traffic.
To view a report generated from auto-learning data

|
To view auto-learning reports, the Adobe Flash Player browser plug-in is required. |
1. Go to Auto Learn > Auto Learn Report > Auto Learn Report.
To access this part of the web UI, your administrator’s account access profile must have Read and Write permission to items in the Autolearn Configuration category. For details, see Permissions.
2. Mark the check box for the report you want to see.
3. Click View.
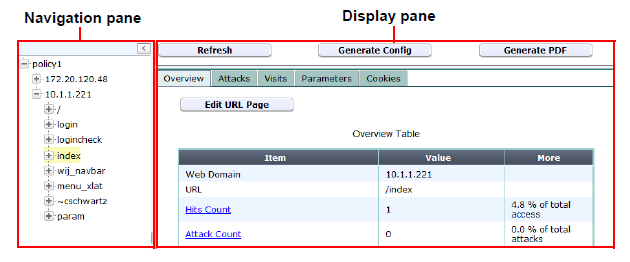
The report appears, with two panes:
- The left-hand pane enables you to navigate through the web sites and URLs that are the subjects of the report.
- The right-hand pane includes tabs that display the report data.
If a report contains multiple pages of results, click the arrows at the bottom of the page to move forward or backwards through the pages of results.
Parts of auto-learning reports
See also
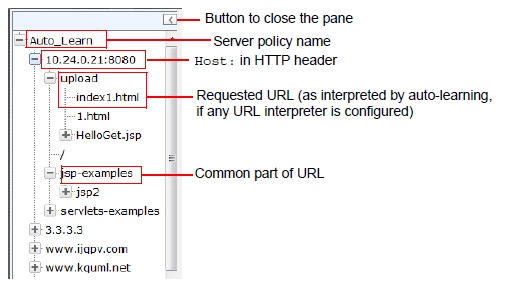
Using the report navigation pane
To view report data, click the expand icon ( + ) next to items in the navigation tree and click items to see applicable information. Different tree levels provide different report data.
Parts of the report navigation pane
|
|
If URL rewriting is configured, the tree’s URL is the one requested by the client, not the one to which it was rewritten before passing on. |
|
|
If the tree contains many URLs that are actually forms of the same URL, or includes sessions IDs, such as:
/app/login.asp;jsessionid=xxx;p1=111;p2=123?p3=5555&p4=66aaaaa
the web application may use dynamic URLs or unusual parameter separators, and require a URL interpreter for auto-learning to function normally. For details, see Auto-learning
|
You can change the display and content of data using the context menu. To do so, right-click the name of an item in the navigation tree, then select a pop-up menu option:
| Refresh the Tree |
Select to update the display in the navigation pane. If hosts or URLs have been discovered since you last loaded the auto-learning report web page, this will update the tree to reflect those new discoveries. |
| Filter the Tree |
Select to show or hide HTTP sessions in the report by their HTTP request method and/or other attributes. A pop-up dialog appears. See Filtering an auto-learning report. |
| Expand Current Node |
Select to expand the item and all of its subitems.
This option has no effect when right-clicking the name of the auto-learning profile.
|
| Stop Learning |
Select this option if you have determined that the item is a dynamic URL. For details, see Pausing auto-learning for a URL.
If you have erroneously categorized the URL as dynamic, to resume learning, right-click the URL again and select Start Learning.
|
| Clean Data |
Select to remove auto-learning’s statistical data for this item. This may be useful if either:
- You want to clear the data set to begin fresh for a new phase of auto-learning.
- You know that the inputs required by a specific URL have changed since you initially began learning about a web site’s parameters. This could happen when you upgrade a web application.
- The item was an instance of a dynamic URL, and you did not apply a matching URL interpreter, and therefore the data was corrupted.
See Removing old auto-learning data.
|
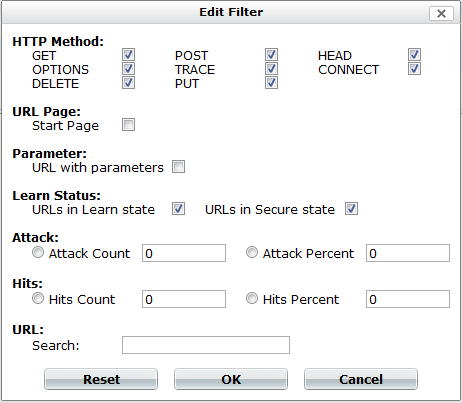
If you select Filter the Tree, a dialog appears.
Filtering an auto-learning report
Depending on its level in the navigation tree, an item may be either a server policy observing multiple hosts, a single host, a common part of a path contained in multiple URLs, or a single requested file. Depending on the part of the navigation tree that you select, the auto-learning report displays:
- statistics specific to each requested URL
- totals for a group of URLs with a common path
- totals for all requested URLs on the host
- totals for all requests on all hosts observed by the auto-learning profile
To show only specific nodes in the URL tree and hide the rest (that is, “filter”), select which attributes that a node or its subnode must satisfy in order to be included in the report’s statistics.
For example, to include only statistics for parts of the URL tree pertaining to HTTP POST requests to Java server pages (JSP files), you would enter .jsp in the Search field under URL and enable POST under HTTP Method, disabling in order to filter out all other HTTP methods.
|
|
If auto-learning is using a URL interpreter to understand the structure of your application’s URLs, search for the interpreted URL as it appears in the report’s navigation tree, not the real URL as it appears in the HTTP request. |
See also
Using the report display pane
Tabs, statistics and charts appear on the report display (right-hand) pane. Their appearance varies depending on which level you selected in the navigation tree.
The report display pane contains several feature buttons above the report.
Buttons at the top of the auto-learning report’s display pane
| Refresh |
Click to update the report display to reflect statistics, if any, that have been gathered since you loaded the auto-learning report web page. |
| Generate Config |
Click to generate a web protection profile from the auto-learning profile. For instructions, see Generating a profile from auto-learning data. |
| Generate PDF |
Click to download a PDF copy of the report. A pop-up dialog appears. Type a file name for the PDF, then click OK. |
Overview tab
The Overview tab provides a statistical summary for all sessions established with the host during the use of the auto-learning profile, or since its auto-learning data was last cleared, whichever is shorter. The contents and buttons of the Overview tab change depending on the level in the navigation tree.
Auto-learning report Overview tab
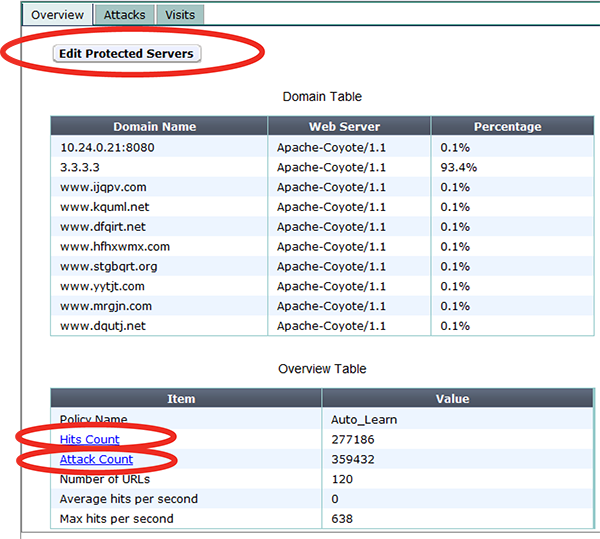
| Edit Protected Servers |
Click to open a dialog where you can select or deselect IP addresses and/or domain names that will be members of the protected host names group for the generated profile.
This button appears only when you select the policy in the navigation pane.
|
| Edit URL Page |
Click to open a dialog where you can specify that the currently selected URL will be allowed, and whether it will be regarded as a start page for the generated profile. You can also select which action to take if there is a rule violation:
-
Alert & Deny — Block the request (reset the connection) and generate an alert email and/or log message.
You can customize the web page that FortiWeb returns to the client with
the HTTP status code. See Customizing error and authentication pages (replacement messages).
- Continue — Continue by evaluating any subsequent rules defined in the web protection profile (see Sequence of scans). If no other rules are violated, allow the request. If multiple rules are violated, a single request will generate multiple attack log messages and/or alert email.
- Pass — Allow the request. Do not generate an alert email and/or log message.
This button appears only when you select a URL in the navigation pane.
|
| Hits Count |
Click the link to go to the Visits tab.
This row appears in the Item column of the Overview table.
|
| Attack Count |
Click the link to go to the Attacks tab.
This row appears in the Item column of the Overview table.
|
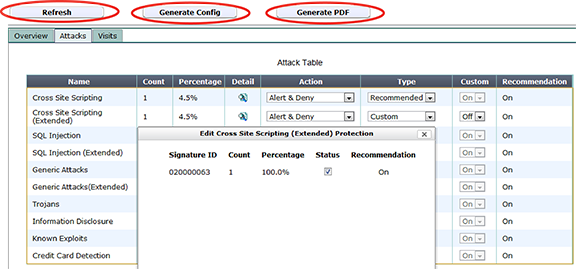
Attacks tab
The Attacks tab provides statistics in both tabular and graphical format on HTTP sessions that contained one of the types of attacks that the web protection profile was configured to detect.
|
|
Sometimes, auto-learning reports may contain fewer attacks than you see in the FortiWeb appliance’s attack logs. For details, see About the attack count. |
Auto-learning report Attacks tab
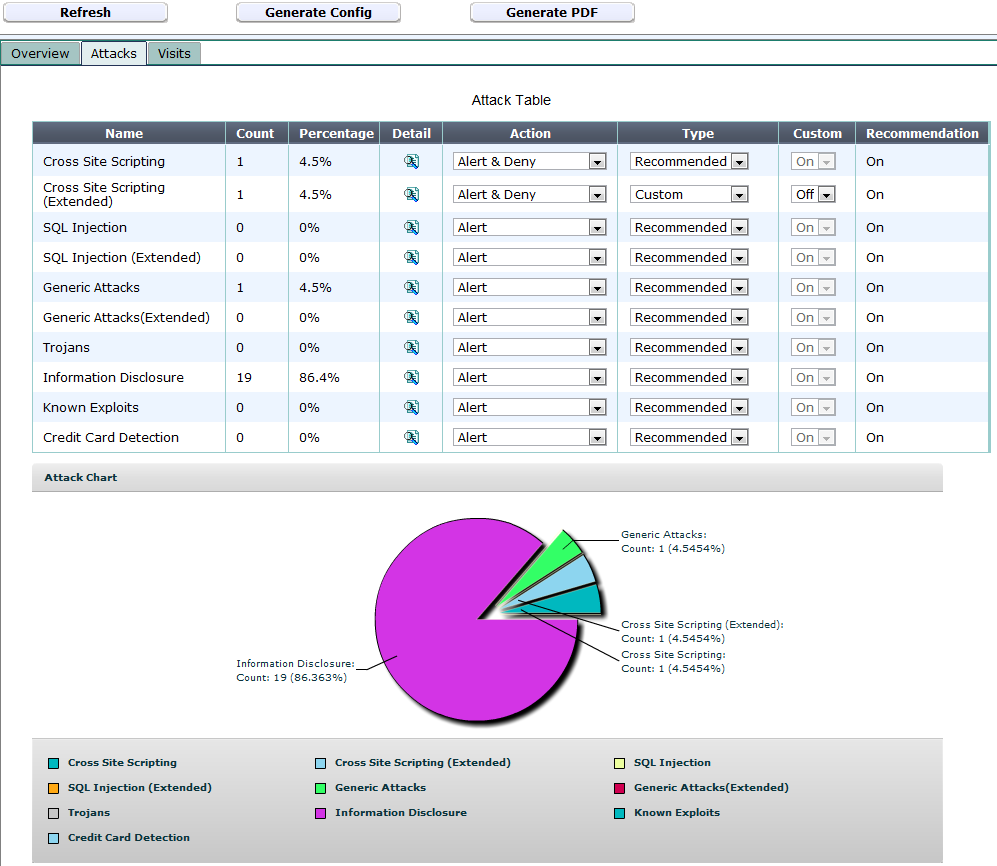
Depending on the level of the item selected in the navigation pane, the Action and Enable columns may appear. Using these settings, you can override the FortiWeb’s statistically suggested attack protection settings.
To display a pop-up list of an attack type’s protection profile settings estimated from current auto-learning data, click the Detail icon. The dialog that appears may vary by the attack type. You can use it to manually override the estimated settings.
To override configuration suggested by auto-learning for a specific attack type
1. From the drop-down list in the Type column, select either:
- Recommended — Do not override the suggestion. FortiWeb automatically estimates whether enabling or disabling scans for each attack signature is appropriate, based upon auto-learning data. When you generate a protection profile, FortiWeb will use whichever setting is indicated by the current auto-learning data.
- Custom — Override the suggestion. When you generate a protection profile, FortiWeb will use the setting indicated by you, not the current auto-learning data.
2. If you selected Custom from Type, from each drop-down list in the Custom column, select one of these options:
- On — Manually override the suggestion. In step 3, select which attack prevention signatures to enable. (Non-selected signatures will be disabled.)
- Off — Manually override the suggestion, and disable all attack prevention signatures for this type.
|
|
If the URL is not susceptible to a specific type of attack, select Off to improve performance. |
Auto-learning report Attacks tab — Manually enabling attack signatures
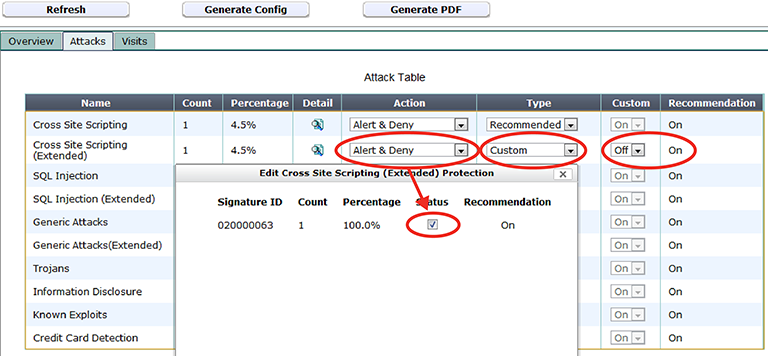
3. In the row for each attack type where you have set the drop-down list to Custom, click the Detail icon.
A dialog appears which lists the individual attack signatures for that attack category.
4. For each signature that you want to manually enable, mark its Status check box.

|
You must mark the Status check box of every signature that you want to enable. Failure to select any signatures will effectively disable attack prevention, even though you have selected On from the Enable drop-down lists for the attack category. |
5. Click OK.
6. From each drop-down list in the Action column, select one of the following options:
|
|
If FortiWeb is deployed behind a NAT load balancer, when using Period Block, you must also define an X-header that indicates the original client’s IP (see Defining your proxies, clients, & X-headers). Failure to do so may cause FortiWeb to block all connections when it detects a violation of this type. |
About the attack count
Sometimes, auto-learning reports may contain fewer attacks than you see in the FortiWeb appliance’s attack logs.
In some cases, the count is low because the attack was attempted, but was targeted towards a URL that did not actually exist on the server (that is, it resulted in an HTTP 404 File Not Found reply code). Because the URL did not exist, the auto-learning report does not include it in its tree of requested URLs. In other words, the attack was not counted in the report because it did not result in an actual page hit.
Visits tab
The Visits tab displays the following statistics:
- When a policy is selected in the navigation tree, bar chart information about the most and least-used URLs
- When a host is selected, tabular information on HTTP return codes in the 400 and 500 series
- When the policy or a host is selected, tabular information on the rate of file requests (hits) by IP address and content type
Buttons above the tables and charts allow you to edit the profile that auto-learning generates from the Visits tab statistics.
Auto-learning report Visits tab (image truncated)
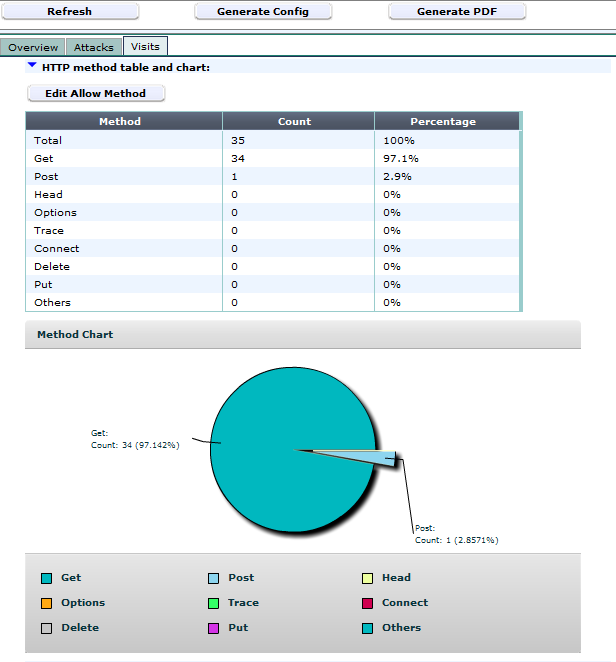
| Edit Allow Method
|
Allows you to specify whether an HTTP request method is allowed in the generated profile using one of the following values:
- On — Enable the method in the generated profile.
- Off — Disable the method in the generated profile.
- Default — When you generate a protection profile, FortiWeb automatically determines whether to enable or disable the HTTP method in the profile based on current auto-learning data.
Available only when a policy is selected in the navigation tree.
|
| Edit Exception Method
|
Allows you to specify whether an HTTP request method is an exception in the generated profile using one of the following values:
- On — Enable the method for the URL in the generated profile.
- Off — Disable the method for the URL in the generated profile.
- Default — When you generate a protection profile, FortiWeb automatically determines whether to enable or disable the HTTP method in the profile based on current auto-learning data. FortiWeb will use whichever setting is indicated by the current auto-learning data.
Available only when individual URL is selected in the navigation tree.
|
|
Edit URL Access
(In the Most hit URL table and chart section)
|
Click this button to open a dialog where you can select which pages will be included in a URL access rule whose Action is Pass (i.e. allow the request and do not generate an attack log message). To include the URL, click and drag it from the column named Available on the right into the column on the left, named URL Access rules with action 'Pass'.
Essentially, auto-learning’s assumption in this case is that most page hits are legitimate, so that URLs that are frequently hit should be normally accessible.
This button appears only when you select the policy in the navigation pane.
|
| Edit Start Page
|
Click this button to open a dialog where you can select which pages will be included in a URL access rule whose Action is Pass (i.e. allow the request and do not generate an attack log message). To include the URL, click and drag it from the column named Available on the right into the column on the left, named URL Access rules with action 'Pass'.
This button appears only when you select the policy in the navigation pane.
|
|
Edit URL Access
(In the Least hit URL table and chart section)
|
Click this button to open a dialog where you can select which pages will be included in a URL access rule whose Action is Alert & Deny (i.e. block the request and generate an alert email and/or attack log message). To include the URL, click and drag it from the column named Available on the right into the column on the left, named URL Access rules with action 'Alert & Deny'.
Essentially, auto-learning’s assumption in this case is that most page hits are legitimate, so that URLs that are not frequently hit possibly could be a back door or other hidden URL, and therefore should not be accessible.
This button appears only when you select the policy in the navigation pane.
|
|
Edit URL Access
(In the Suspicious URL table and chart section)
|
Click this button to open a dialog where you can select which pages will be included in a URL access rule whose Action is Alert & Deny (i.e. block the request and generate an alert email and/or attack log message). To include the URL, click and drag it from the column named Available on the right into the column on the left, named URL Access rules with action 'Alert & Deny'.
Essentially, auto-learning’s assumption in this case is that administrative URLs should not be accessible to the general public on the Internet, so that requests for these URLs could be a potential attack or scouting attempt, and should be blocked.
This button appears only when you select the policy in the navigation pane.
|
|
Edit Content Type
(In the Most hit IP table section)
|
Allows you to specify which content types FortiWeb includes in any Advanced Protection custom rule it generates using Most hit IP table data.
By default, the following content types are selected:
- application/soap+xml
- application/xml(or)text/xml
- text/html
- text/plain
- application/json
The custom rule FortiWeb generates is designed to detect and prevent web scraping (content scraping) activity.
For more information, see Most hit IP table and web scraping detection.
|
Most hit IP table and web scraping detection
The Most hit IP table displays the data that FortiWeb uses to automatically generate Advanced Protection custom rules that target web scraping (also called content scraping, web harvesting, or web data extraction). Web scraping is an automated process for collecting information from the web. In many cases, web scraping is performed with the intention of re-using the content without authorization.
For efficiency, web scrapers scan web sites quickly, which generates a file request rate that is noticeably higher than non-automated traffic. However, web scrapers also target dynamic web site content, represented by content types such as XML, soap/XML, JSON, and text/plain, rather than static content like graphics files.
Therefore, for its web scraping custom rule data, FortiWeb collects statistics for both the rate of requests for files (hit rate) and the type of content requested. By creating a rule that accounts for the content type, FortiWeb can provide targeted protection against web scraping in addition to its DoS prevention features, which focus on rate alone.
The Most hit IP table displays the following information:
- The IP addresses that had the highest rate of requests for files (hit rate) during the auto-learning period
- Statistics on the types of content that clients requested
To determine the most-hit IP addresses, the auto-learning feature divides the auto-learning period into five-minute observation periods. It records the total number of hits that individual IP addresses receive during each five-minute period. The Visits tab displays information about the ten observation periods that had the highest number of hits, including the source IP address and details about the content types of files.
When you generate a profile using the auto-learning report, FortiWeb generates an Advanced Protection custom rule for each selected row in the Most hit IP table. (The first row is selected by default.) FortiWeb converts the data in the row to a baseline maximum hit rate for a specific IP address and content type. When web scraping activity generates a higher hit rate, it triggers the rule action.
Each generated custom rule contains the following filters:
-
Content Type — Matches requests for files of the specified type.
By default, the following content types are selected:
- application/soap+xml
- application/xml(or)text/xml
- text/html
- text/plain
- application/json
Use Edit Content Type to customize the values that FortiWeb uses in the filter.
- Occurrence — Matches requests for files that match the Content Type filter and exceed a threshold that FortiWeb calculates using the values found in the Most hit IP table item.
For example, Most hit IP table contains an item with the following values. The values represent hit statistics during an observation period that was among the top ten:
| 10.200.0.1
|
text/html |
44 |
81.48% |
| unrecognized content-type |
10 |
18.52% |
| Total |
54 |
100% |
This item generates an Advanced Protection custom rule with a Content Type filter that matches text/html content (one of the default types) and an Occurrence filter with the following values:
| Occurrence |
44 |
The number of times clients requested this type of file from the source IP during this top-ten observation period.
If the Most hit IP table has statistics for more than one of the selected content types, the value is the total count for all the content types.
|
| Within |
300 |
The length of the observation period. The auto-learning feature collects hits by source IP data using a 5-minute (300 second) observation period. |
| Enable Percentage Matching |
Selected |
Specifies that the filter matches when the number of hits of the specified content types, expressed as a percentage of the total number of hits, exceeds the value of Percentage of Hits. |
| Percentage of Hits |
81 |
The number of times clients requested the specified type of file from the source IP, expressed as a percentage of the total number of hits for the source IP in the observation period.
If the Most hit IP table has statistics for more than one of the selected content types, the value is the total of all content types.
|
| Traced By |
Source IP |
Most hit IP table data is based on hits by source IP, although you can create an Occurrence filter based on User. |
For more information about Advanced Protection custom rules, see Combination access control & rate limiting.
Parameters tab
The Parameters tab provides tabular statistics on the parameters and their values as they appeared in HTTP requests, as well as any parameters that were extracted from the URL by a URL interpreter.
Auto-learning report Parameter tab
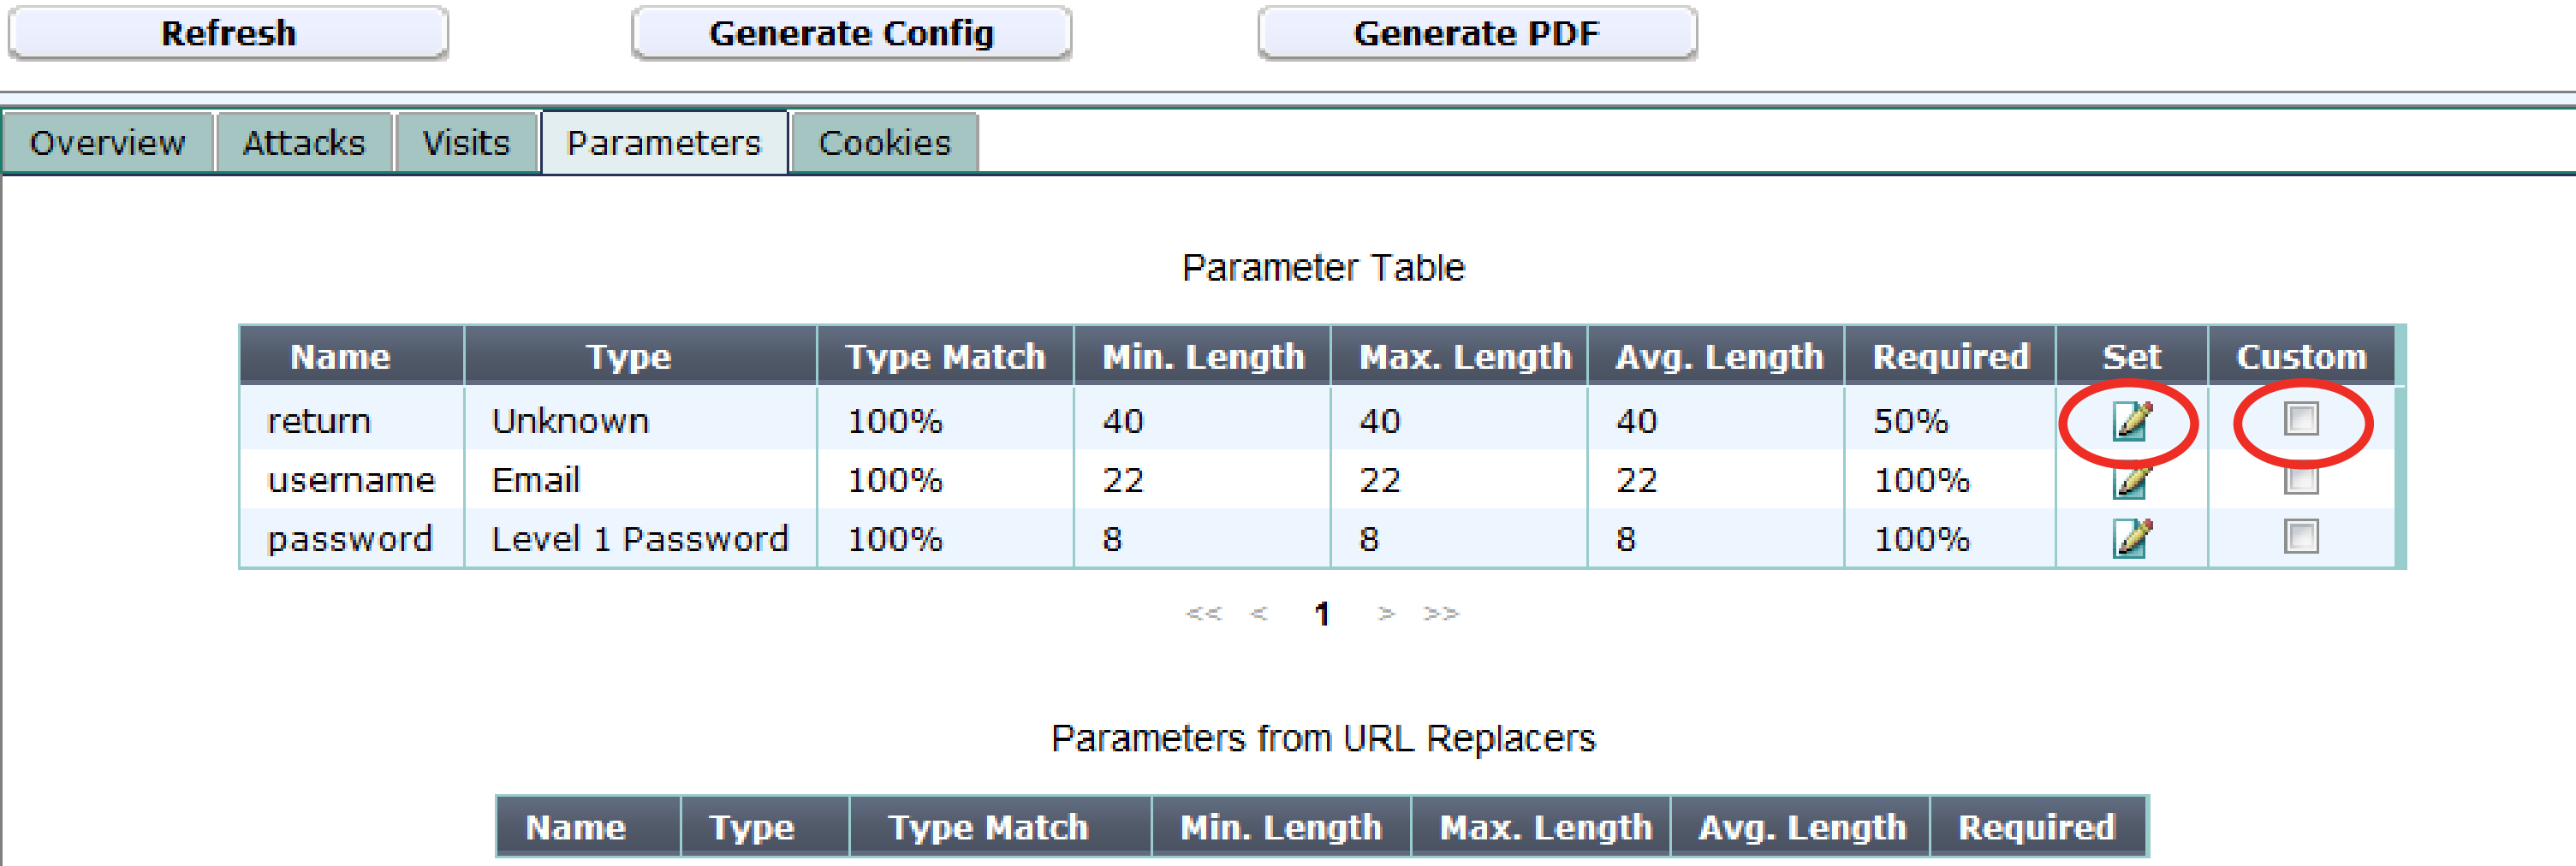
This tab appears only for items that are leaf nodes in the navigation tree; that is, they represent a single complete URL as it appeared in a real HTTP request, and therefore could have had those exact associated parameters.
The Name column contains the name of the parameter, exactly as it was observed in the parameter or (for parameters extracted by URL replacers) within the URL.
|
|
If the Name column contains part of a URL or the parameter’s value instead of its name, verify the regular expression and back references used in your URL replacer. |
Percentages in the Type Match and Required columns indicate how likely the parameter with that name is of that exact data type, and whether or not the web application requires that input for that URL. The Min. Length and Max. Length columns indicate the likely valid range of length for that input’s value. The Avg. Length column indicates the average length for that input’s value. Together, the columns provide information on what is likely the correct configuration of a profile for that URL.
For example, if Max. Length is 255 but Min. Length is 63 and Avg. Length is 64, before generating a protection profile, you may want to investigate to determine whether 255 is indeed an appropriate maximum input length, since it deviates so much from the norm. In this case, the intended minimum and maximum length might really be 63, but a single malicious observed input had a maximum length of 255.
By default, when you generate a protection profile from auto-learning data, FortiWeb will use these statistics to estimate appropriate input rules. However, if auto-learning suggestions are not appropriate, you can manually override these estimates by using the Set icon and Custom check box before generating a protection profile. For details, see Auto-learning.
Cookies tab
The Cookies tab provides tabular statistics on the name, value, expiry date, and associated URL (path) of each cookie crumb that appeared in HTTP requests.
Cookies that you see in this table can be protected by enabling Cookie Poisoning.
Auto-learning report Cookies tab
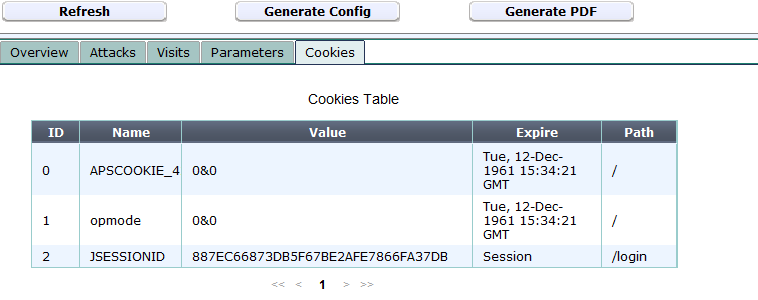
This tab appears only for hosts that use cookies, and for items that are leaf nodes in the navigation tree; that is, they represent a single complete URL as it appeared in a real HTTP request, and therefore could have had those exact cookies.
See also
Open topic with navigation