
What's New in FortiOS 5.6
This chapter describes new features added to FortiOS 5.6.0, 5.6.1, and 5.6.3.
FortiOS 5.6.3
These features first appeared in FortiOS 5.6.3.
Administrator password changes (414927)
The existing Change Password dialog that appears in the GUI is updated to reflect the new look of the password change prompt at login.
- Added inline validation for checking password policy and password reuse
- Changed style to match new login prompt password change
- Fixed issue where fDialog would close slide out on submission failure
Support FortiOS to allow user to select domain when logging a FG into FortiCloud (452350)
Support has been added to show a list of all possible FortiCloud domains that the FortiGate can be served by.
Syntax
execute fortiguard-log domain
This command is typically used for testing purposes, and so it will not appear when entering execute fortiguard-log ?.
FortiOS 5.6.1
These features first appeared in FortiOS 5.6.1.
VM License visibility improvement (423347)
VM License GUI items have changed as follows:
- Added VM widget to Global > Dashboard. Includes the following:
- License status and type.
- CPU allocation usage.
- License RAM usage.
- VMX license information (if the VM supports VMX).
- If the VM license specifies 'unlimited' the progress bar is blank.
- If the VM is in evaluation mode, it is yellow (warning style) and the dashboard show evaluation days used.
- Widget is shown by default in the dashboard of a FortiOS VM device.
- Removed VM information from License widget at Global > Dashboard.
- License info and Upload License button provided on page Global > System > FortiGuard.
- Updated 'Upload VM License' page:
- Added license RAM usage and VMX instance usage.
- Replaced file input component.
CLI Syntax
config sys admin
edit <name>
config gui-dashboard
edit <1>
set name <name>
config widget
edit <2>
set type {vminfo | ...} <- new option
set x-pos <2>
set y-pos <1>
set width <1>
set height <1>
next
end
next
end
next
end
FortiView Dashboard Widget (434179)
Added a new widget type to the dashboard for top level FortiView. FortiView widgets have report-by, sort-by, visualization, timeframe properties, and filters subtable in the CLI.
Supported FortiViews include Source, Destination, Application, Country, Interfaces, Policy, Wifi Client, Traffic Shaper, Endpoint Vulnerability, Cloud User, Threats, VPN, Websites, and Admin and System Events.
Bubble, table, chord chart, and country visualizations are supported in the widget.
Widgets can be saved from a filtered FortiView page on to a dashboard.
Syntax
config system admin
config gui-dashboard
config widget
set type fortiview
set report-by {source | destination | country | intfpair | srcintf | dstintf | policy | wificlient | shaper | endpoint | application | cloud | web | threat | system | unauth | admin | vpn}
set timeframe {realtime | 5min | hour | day | week}
set sort-by <string>
set visualization {table | bubble | country | chord}
config filters
set key <filter_key>
set value <filter_value>
end
end
end
end
end
Where:
report-by= Field to aggregate the data by.timeframe= Timeframe period of reported data.sort-by= Field to sort the data by.visualization= Visualization to use.
Controls added to GUI CLI console (422623)
FortiOS 5.6.1 introduces new options in the browser CLI console to export the console history. Options are now available to Clear console, Download, and Copy to clipboard.

FortiExplorer icon enhancement (423838)
FortiOS icons and colors are now exportable in the GUI shared project and FortiExplorer now uses these icons and colors. This change improves the icon colors only for the FortiExplorer GUI theme (seen only when accessing a web GUI page from within the FortiExplorer iOS app).
The following locations were affected: Policy List, Policy Dialogue, Address List, Address Dialogue, Virtual IP list, Virtual IP Dialogue.
FortiOS 5.6
These features first appeared in FortiOS 5.6.
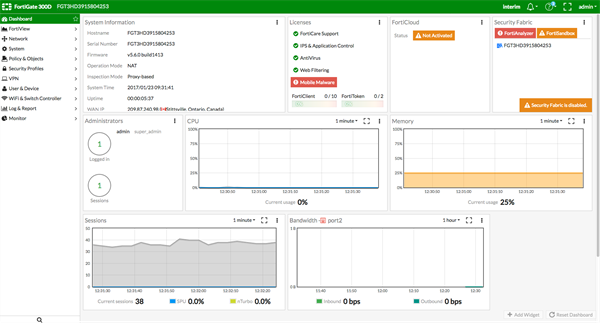
The FortiOS 5.6 Dashboard has a new layout with a Network Operations Center (NOC) view with a focus on alerts. Widgets are interactive; by clicking or hovering over most widgets, the user can get additional information or follow links to other pages.
Enhancements to the GUI dashboard and its widgets are:
- Multiple dashboard support.
- VDOM and global dashboards.
- Updated resize control for widgets.
- Notifications moved to the top header bar (moved existing dashboard notifications to the header and added additional ones).
- Reorganization of Add Widget dialog.
- New Host Scan Summary widget.
- New Vulnerabilities Summary widget that displays endpoint vulnerability information much like the FortiClient Enterprise Management Server (EMS) summary.
- Multiple bug fixes.
Features that were only visible through old dashboard widgets have been placed elsewhere in the GUI:
- Restore configuration.
- Configuration revisions.
- Firmware management.
- Enabling / disabling VDOMs.
- Changing inspection mode.
- Changing operation mode.
- Shutdown / restart device.
- Changing hostname.
- Changing system time.
The following widgets are displayed by default:
- System Information
- Licenses
- FortiCloud
- Security Fabric
- Administrators
- CPU
- Memory
- Sessions
- Bandwidth
- Virtual Machine (on VMs and new to FortiOS 5.6.1)
The following optional widgets are available:
- Interface Bandwidth
- Disk Usage
- Security Fabric Risk
- Advanced Threat Protection Statistics
- Log Rate
- Session Rate
- Sensor Information
- HA Status
- Host Scan Summary
- Vulnerabilities Summary
- FortiView (new to FortiOS 5.6.1)
The following widgets have been removed:
- CLI Console
- Unit Operation
- Alert Message Console
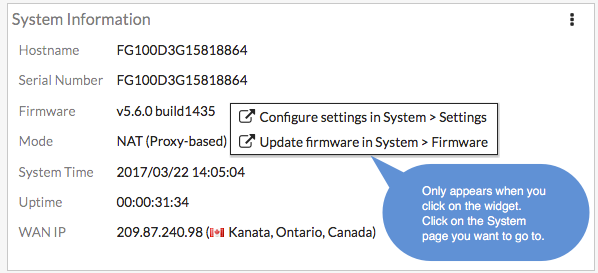
System Information
FortiGuard WAN IP blacklist service is now online
The Fortiguard WAN IP blacklist service was not online in FortiOS 5.6.0. In FortiOS 5.6.1, a notification appears on the Dashboard when WAN IP is blacklisted. Clicking on the notification (bell icon) brings up the blacklist details.

Licenses
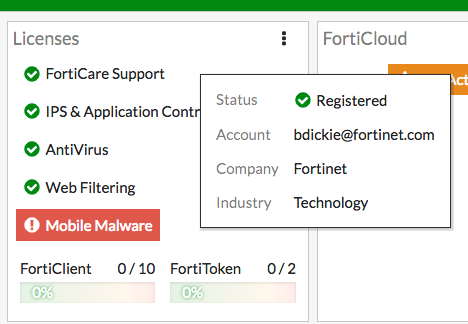
Hovering over the Licenses widget will cause status information (and, where applicable, database information) on the licenses to be displayed for FortiCare Support, IPS & Application Control, AntiVirus, Web Filtering, Mobile Malware, and FortiClient. The image below shows FortiCare Support information along with the registrant's company name and industry.
Clicking in the Licenses widget will provide you with links to other pages, such as System > FortiGuard or contract renewal pages.
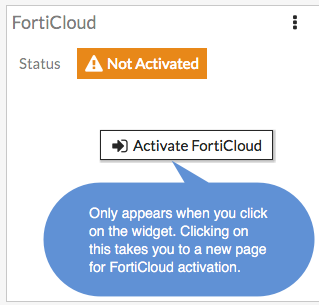
FortiCloud
This widget displays FortiCloud status and provides a link to activate FortiCloud.
Fortinet Security Fabric
The Security Fabric widget is documented in the Security Fabric section of the What's New document.
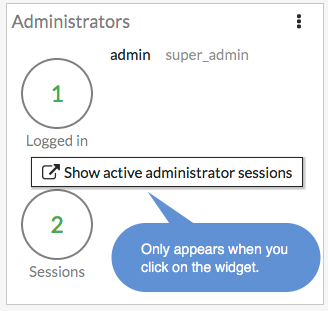
Administrators
This widget allows you to view which administrators are logged in and how many sessions are active. The link directs you to a page displaying active administrator sessions.
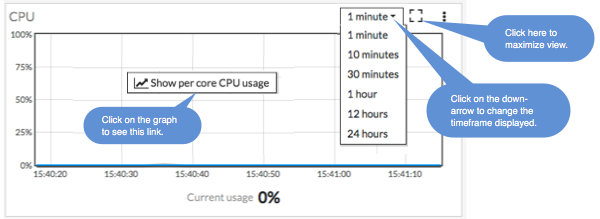
CPU
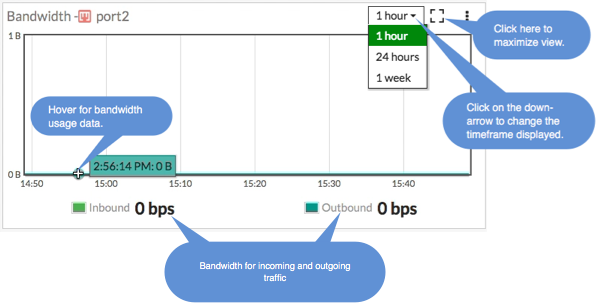
The real-time CPU usage is displayed for different timeframes.
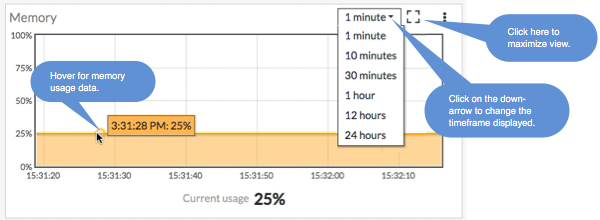
Memory
Real-time memory usage is displayed for different time frames. Hovering over any point on the graph displays percentage of memory used along with a timestamp.
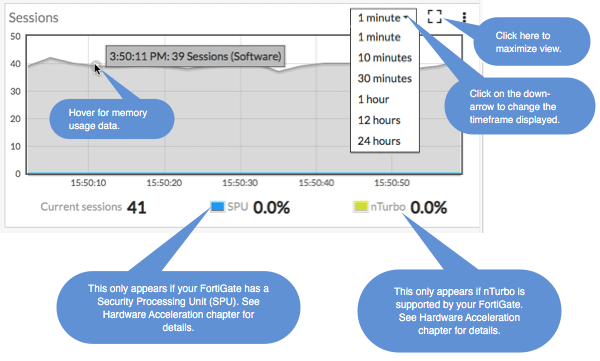
Sessions
Bandwidth
Virtual Machine
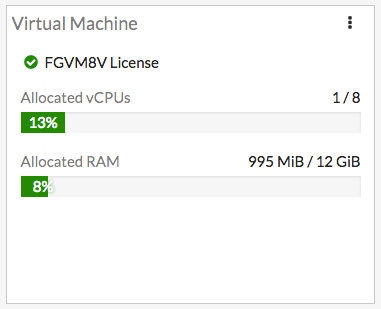
FortiOS 5.6.1 introduces a VM widget with these features:
- License status and type.
- CPU allocation usage.
- License RAM usage.
- VMX license information (if the VM supports VMX).
- If the VM license specifies 'unlimited' the progress bar is blank.
- If the VM is in evaluation mode, it is yellow (warning style) and the dashboard show evaluation days used.
- Widget is shown by default in the dashboard of a FortiOS VM device.
- Removed VM information from License widget at Global > Dashboard.
- License info and Upload License button provided on page Global > System > FortiGuard.
- Updated 'Upload VM License' page:
- Added license RAM usage and VMX instance usage.
- Replaced file input component.
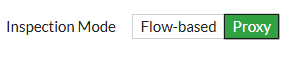
Changing inspection modes (flow-based or proxy-based)
To change inspection modes, go to System > Settings and scroll down to Inspection Mode. You can select Flow-based to operate in Flow mode or Proxy to operate in Proxy mode. Flow-based inspection is the default inspection mode for FortiOS 5.6.
Transparent Web proxy mode
In proxy mode, FortiOS 5.6 functions just like FortiOS 5.4 with the addition of the new Transparent Web Proxy mode. See Transparent web proxy (386474).
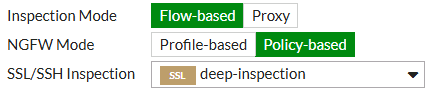
NGFW profile-based and NGFW policy-based modes
When you use Flow-based as the Inspection Mode, you have the option in FortiOS 5.6 to select an NGFW Mode. Profile-based mode works the same as flow-based mode did in FortiOS 5.4
Flow-based inspection with profile-based NGFW mode is the default in FortiOS 5.6.
In the new NGFW Policy-based mode, you add applications and web filtering profiles directly to a policy without having to first create and configure Application Control or Web Filtering profiles. When selecting NGFW policy-based mode you can also select the SSL/SSH Inspection mode that is applied to all policies. See NGFW Policy Mode (397035).
When you use flow-based inspection, all proxy mode profiles are converted to flow mode, removing any proxy settings. And proxy-mode only features (for example, Web Application Profile) are removed from the GUI.
If your FortiGate has multiple VDOMs, you can set the inspection mode independently for each VDOM. Go to System > VDOM. Click Edit for the VDOM you wish to change and select the Inspection Mode.
CLI syntax
The following CLI commands can be used to configure inspection and policy modes:
config system settings
set inspection-mode {proxy | flow}
set policy-mode {standard | ngfw}
end
Change to CLI console (396225)
The CLI Console widget has been removed from FortiOS 5.6.0. It is accessed from the upper-right hand corner of the screen and is no longer a pop-out window but a sliding window.
System Information Dashboard widget WAN IP Information enhancement (401464)
WAN IP and location data are now available in the System Information widget. Additionally, If the WAN IP is blacklisted in the FortiGuard server, there will be a notification in the notification area, located in the upper right-hand corner of the Dashboard. Clicking on the notification will open the WAN IP Blacklisted slider with the relevant blacklist information.
CLI and GUI changes to display FortiCare registration information (395254)
The changes pertain to industry and organization size of the FortiGate's registered owner.
GUI Changes
- Add industry and organization size to FortiCare registration page
- Add company and industry to license widget tooltip for FortiCare
When you hover over the Licenses widget in the FortiOS 5.6 dashboard, you can see the company and industry data, provided it has been entered in the FortiCare profile.
CLI Changes
Commands are added to diagnose forticare
dia forticare direct-registration product-registration -h
Options: a:A:y:C:c:T:eF:f:hI:i:l:O:o:p:P:z:R:r:S:s:t:v:
--<long> -<short>
account_id a:
address A:
city y:
company C:
contract_number c:
country_code T:
existing_account e
fax F:
first_name f:
help h
industry I:
industry_id i:
last_name l:
orgsize O:
orgsize_id o:
password p:
phone P:
postal_code z:
reseller R:
reseller_id r:
state S:
state_code s:
title t:
version v:
Improved GUI for Mobile Screen Size & Touch Interface (355558)
The FortiOS web GUI on mobile screens and include functionality for touch interfaces like tap to hold are improved.
Setup Wizard removed
Previously, the Setup Wizard could be launched from the web GUI by selecting the  button, located in the top right corner. This button and the wizard in question has been removed.
Copyright © 2021 Fortinet, Inc. All Rights Reserved. | Terms of Service | Privacy Policy