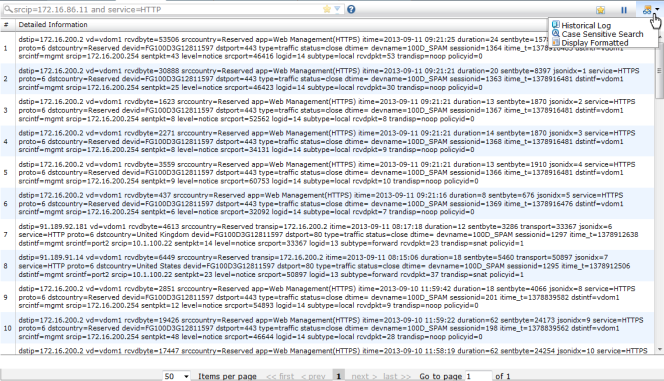
Figure 223: Traffic log window (Formatted)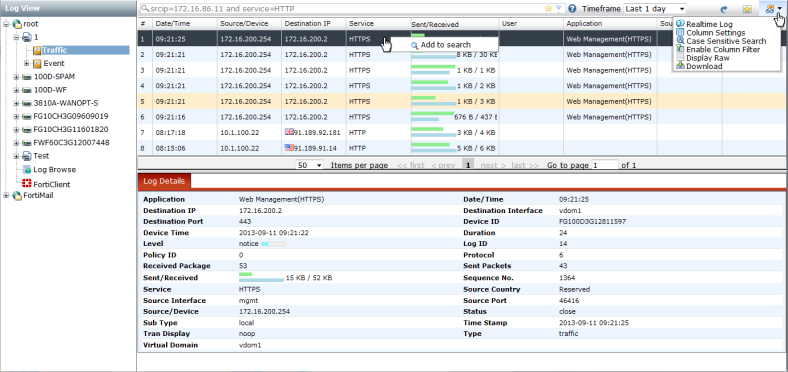
Search | Enter a search syntax. Select the drop-down icon to view History, Bookmarks, and Filters. Perform a search based on the filters. The filters available will vary based on device type and log type. | |
Star Icon | Select the star icon to save the search to favorites (bookmarks). | |
Question Mark Icon | Hover your mouse over this icon for example search syntax. | |
Timeframe | Select a time frame from the drop-down list. Select one of the following: Any time, Last 1 hour, Last 1 day, Last 7 days, or Last 30 days. | |
Refresh Icon | Refresh the log view. | |
Bookmarks Icon | Select the bookmarks icon to view all saved searches. Use the right-click menu to delete entries from bookmarks or paste the entry into the search field. | |
View Icon | When selecting the view icon a menu is displayed with the following options: • Download | |
Realtime Log, Historical Log | Select this menu item to switch between Realtime Log and Historical Log. When Realtime Log is selected, logs displayed are updated in real time. When Historical Log is selected, you can search and download logs. | |
Column Settings | The default column settings and available fields will vary by device type. Select the View icon to change the column settings for the page you are currently viewing. This table provides details of the default columns. | |
Case Sensitive Search, Case Insensitive Search | Select this menu item to switch between case sensitive search and case insensitive search modes. | |
Enable/Disable Column Filter | Select to enable or disable column filters. | |
Log Details | Adjust the location and visibility of the Log Details frame. It can be hidden, or visible on the bottom or right side of the content pane. For more information, see “Log details”. | |
Pause/Resume Icon | Select to pause or resume log data. This option is only available when in the real time view. | |
Display Raw Display Formatted | Select either Formatted or Raw. Formatted log view displays log information by column. Raw log view provides a more granular level of log information, see Figure 224. | |
Download | Select to download the logs. Select the log file format in the drop-down list. Select either Text or CSV format. Select the checkbox to compress the log file with gzip. Select to download either the current page or all pages in the log. | |
Columns | Columns will be available, depending on the device type and log type selected in the tree menu. Select the View icon to change the column settings for the page you are currently viewing. This table provides details of the default columns. | |
Add to search | Right-click on a column value and select Add to search to search all logs that contain this value. You can select multiple values for search and save the search to favorites. | |
Traffic | Traffic log columns include the following information: • #: The log entry identifier. • Date/Time: The time the log was generated. Hover the mouse cursor over the entry to view the date and time. • Source/Device: The source device IP address. • Destination IP: The destination IP address and the country flag icon. Hover the mouse cursor over the flag icon to view the country information. • Service • Sent/Received: The number of packets sent and received in kB. Hover the mouse cursor over the entry to view the actual values. • User • Application • Source MAC • Security Action You can use the column filters to display specific logs. Alternatively, you can right-click on a log column entry to add that specific field to the search window and search all logs. You can view the log details in the lower content pane on the page. | |
Event > System | System log columns include the following information: • #: The log entry identifier. • Date/Time: The time the log was generated. Hover the mouse cursor over the entry to view the date and time. • Level: The logging level. Hover the house cursor over the entry to view the logging level. • Message: The log message content. • User You can use the column filters to display specific logs. Alternatively, you can right-click on a log column entry to add that specific field to the search window and search all logs. You can view the log details in the lower content pane on the page. | |
Event > VPN | VPN log columns include the following information: • #: The log entry identifier. • Date/Time: The time the log was generated. Hover the mouse cursor over the entry to view the date and time. • Level: The logging level. Hover the house cursor over the entry to view the logging level. • Action • Message: The log message content. • Status • VPN Tunnel You can use the column filters to display specific logs. Alternatively, you can right-click on a log column entry to add that specific field to the search window and search all logs. You can view the log details in the lower content pane on the page. | |
Event > User | User log columns include the following information: • #: The log entry identifier. • Date/Time: The time the log was generated. Hover the mouse cursor over the entry to view the date and time. • Level: The logging level. Hover the house cursor over the entry to view the logging level. • Action • Message: The log message content. • User • Status • Group You can use the column filters to display specific logs. Alternatively, you can right-click on a log column entry to add that specific field to the search window and search all logs. You can view the log details in the lower content pane on the page. | |
Event > Router | Router log columns include the following information: • #: The log entry identifier. • Date/Time: The time the log was generated. Hover the mouse cursor over the entry to view the date and time. • Level: The logging level. Hover the house cursor over the entry to view the logging level. • Message: The log message content. • IP You can use the column filters to display specific logs. Alternatively, you can right-click on a log column entry to add that specific field to the search window and search all logs. You can view the log details in the lower content pane on the page. | |
Event > Wireless | Wireless log columns include the following information: • #: The log entry identifier. • Date/Time: The time the log was generated. Hover the mouse cursor over the entry to view the date and time. • Level: The logging level. Hover the house cursor over the entry to view the logging level. • Action • Message: The log message content. • SSID • Channel You can use the column filters to display specific logs. Alternatively, you can right-click on a log column entry to add that specific field to the search window and search all logs. You can view the log details in the lower content pane on the page. | |
Security > Web Filter | Web Filter log columns include the following information: • #: The log entry identifier. • Date/Time: The time the log was generated. Hover the mouse cursor over the entry to view the date and time. • Source/Device: The source device IP address. • Destination IP: The destination IP address and the country flag icon. Hover the mouse cursor over the flag icon to view the country information. • Service • Host Name • Status • URL • Category Description • Sent/Received: The number of packets sent and received in kB. Hover the mouse cursor over the entry to view the actual values. You can use the column filters to display specific logs. Alternatively, you can right-click on a log column entry to add that specific field to the search window and search all logs. You can view the log details in the lower content pane on the page. | |
Security > Application Control | Application Control log columns include the following information: • #: The log entry identifier. • Date/Time: The time the log was generated. Hover the mouse cursor over the entry to view the date and time. • Level: The logging level. Hover the house cursor over the entry to view the logging level. • Message: The log message content. • User You can use the column filters to display specific logs. Alternatively, you can right-click on a log column entry to add that specific field to the search window and search all logs. You can view the log details in the lower content pane on the page. | |
Security > Data Leak Prevention | Data Leak Prevention log columns include the following information: • #: The log entry identifier. • Date/Time: The time the log was generated. Hover the mouse cursor over the entry to view the date and time. • User • Source/Device: The source device IP address. • Service • URL • Action • File • Subject • Filter Index • Filter Type • DLP Extra Info You can use the column filters to display specific logs. Alternatively, you can right-click on a log column entry to add that specific field to the search window and search all logs. You can view the log details in the lower content pane on the page. | |
Security > Vulnerability Scan | Vulnerability Scan log columns include the following information: • #: The log entry identifier. • Date/Time: The time the log was generated. Hover the mouse cursor over the entry to view the date and time. • Destination IP: The destination IP address and the country flag icon. Hover the mouse cursor over the flag icon to view the country information. • Vulnerability • Severity • OS • Vulnerability Count • User You can use the column filters to display specific logs. Alternatively, you can right-click on a log column entry to add that specific field to the search window and search all logs. You can view the log details in the lower content pane on the page. | |
Content | Content log columns include the following information: • #: The log entry identifier. • Date/Time: The time the log was generated. Hover the mouse cursor over the entry to view the date and time. • Sub Type • Level: The logging level. Hover the house cursor over the entry to view the logging level. • Client: The client IP address. • Sent/Received: The number of packets sent and received in kB. Hover the mouse cursor over the entry to view the actual values. • Method • URL • To • From • Subject • FTP Command • File • Profile • Local • Remote • Status • Protocol • Action • Chat Message • File Name • File Size • Source/Device: The source device IP address. • Destination IP: The destination IP address and the country flag icon. Hover the mouse cursor over the flag icon to view the country information. • Phone • Host Name You can use the column filters to display specific logs. Alternatively, you can right-click on a log column entry to add that specific field to the search window and search all logs. You can view the log details in the lower content pane on the page. | |
Pages | Settings to adjust the number of logs listed per page and to browse through the pages of logs. | |
Log Details frame | Detailed information on the log message selected in the log message list. See “Log details” for more information. | |