Figure 169: Traffic log window (Formatted)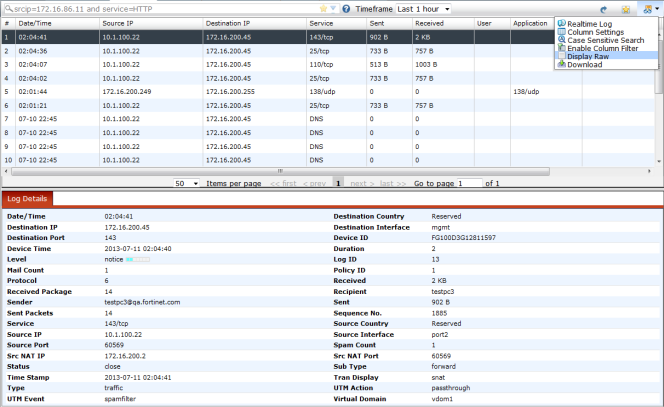
Search | Enter a search syntax. Select the drop-down icon to view History, Bookmarks, and Filters. Perform a search based on the filters. The filters available will vary based on device type and log type. |
Star Icon | Select the star icon to save the search to favorites (bookmarks). |
Question Mark Icon | Hover your mouse over this icon for example search syntax. |
Timeframe | Select a time frame from the drop-down list. |
Refresh Icon | Refresh the log view. |
Bookmarks Icon | Select the bookmarks icon to view all saved searches. Use the right-click menu to delete entries from bookmarks or paste the entry into the search field. |
View Icon | When selecting the view icon a menu is displayed with the following options: • Download |
Realtime Log, Historical Log | Select this menu item to switch between Realtime Log and Historical Log. When Realtime Log is selected, logs displayed are updated in real time. When Historical Log is selected, you can search and download logs. |
Column Settings | The default column settings and available fields will vary by device type. |
Case Sensitive Search, Case Insensitive Search | Select this menu item to switch between case sensitive search and case insensitive search modes. |
Enable/Disable Column Filter | Select to enable or disable column filters. |
Log Details | Adjust the location and visibility of the Log Details frame. It can be hidden, or visible on the bottom or right side of the content pane. For more information, see “Log details”. |
Pause/Resume Icon | Select to pause or resume log data. This option is only available when in the real time view. |
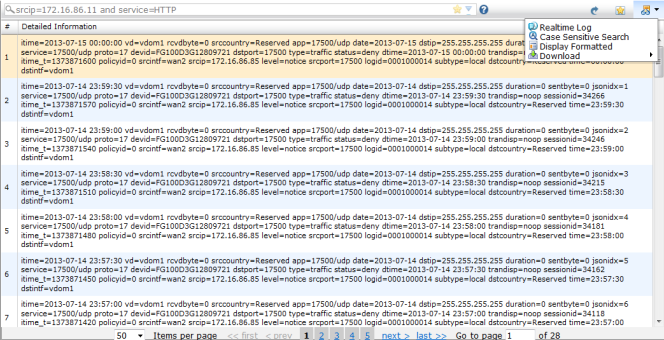
Display Raw Display Formatted | Select either Formatted or Raw. Formatted log view displays log information by column. Raw log view provides a more granular level of log information, see Figure 170. |
Download | Select to download the logs. Select the log file format in the drop-down list. Select either Text or CSV format. Select the checkbox to compress the log file with gzip. Select to download either the current page or all pages in the log. |
Date/Time | The date and time the log was received by the FortiManager unit. |
Other | Other columns will be available, depending on the device type and log type selected in the tree menu. |
Pages | Settings to adjust the number of logs listed per page and to browse through the pages of logs. |
Log Details frame | Detailed information on the log message selected in the log message list. See “Log details” for more information. |