Using the Session Diagnostic report
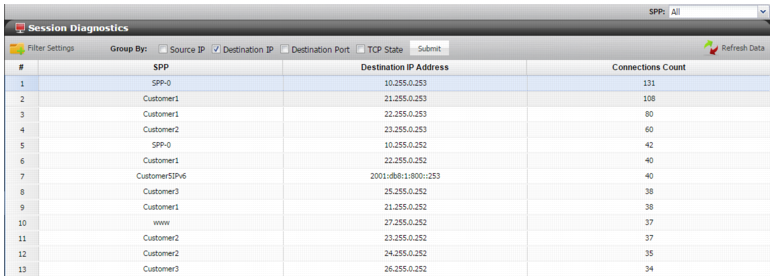
Figure 119 shows the Session Diagnostic report. You can use the Session Diagnostic report to check the session counters. The count is for current traffic. You can correlate the count with source IP address, destination IP address, destination port, or TCP state. You can also filter the records to include or exclude matching expressions.
To display the Session Diagnostic report
1. Go to Log & Report > Diagnostics > Sessions.
2. Select the SPP of interest.
3. Select a Group By option and click Submit.
4. If desired, use the Filter Settings controls to filter records to include or exclude matching expressions.