Figure 86: HTTP Methods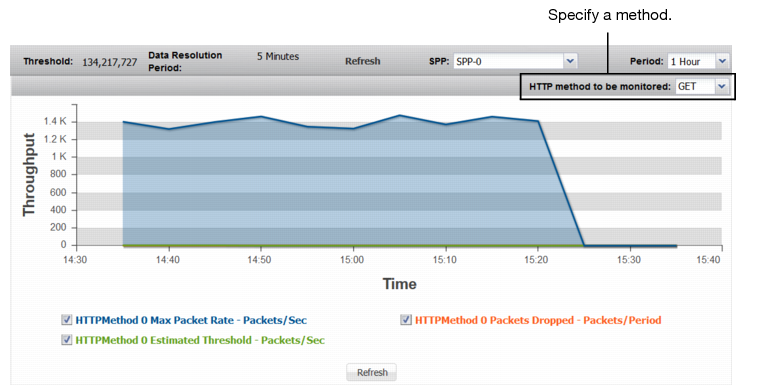
Statistic | Description |
HTTP Methods | |
HTTP Method <Method> Max Packet Rate | Trend in observed maximum rate for the selected HTTP method. The following methods are available: • GET • HEAD • OPTIONS • TRACE • POST • PUT • DELETE • CONNECT |
HTTP Method <Method> Estimated Threshold | Trend in the estimated threshold. The estimated threshold is the rate that triggers drops. In contrast to the configured minimum threshold, which is based on a snapshot of previously recorded data, the estimated threshold adjusts as more traffic is observed. It is almost always higher than the configured minimum threshold, and never lower. It is based on algorithms designed to distinguish attack traffic from traffic increases that are the result of legitimate users accessing the protected system. Factors include historical data, trend, and seasonality. |
HTTP Method <Method> Packets Dropped | Trend in packets dropped due to the effective rate limit. |
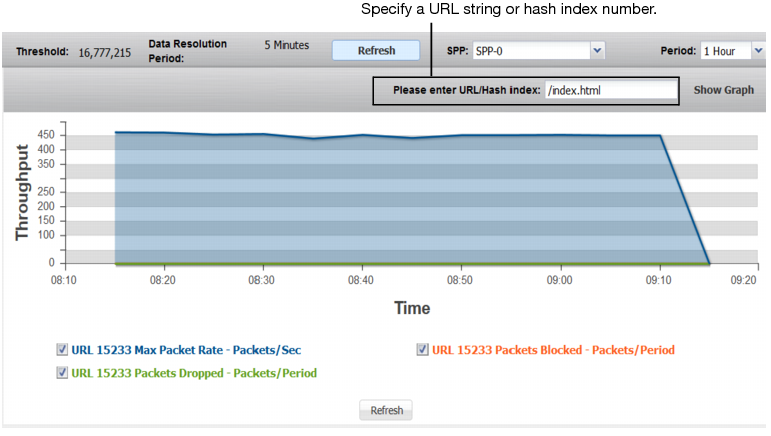
HTTP URLs | |
URL <Index> Max Packet Rate | Trend in observed maximum packet rate of packets with the specified request URL. A spike in this graph shows a possible URL flood. |
URL <Index> Packets Dropped | Trend in packets dropped due to the effective rate limit. |
URL <Index>Packets Blocked | Trend in packets blocked due to related blocking periods. |
HTTP Hosts | |
Host <Index> Max Packet Rate | Trend in observed maximum packet rate of packets with the specified Host header. A spike in this graph shows a possible Host flood. |
Host <Index> Packets Dropped | Trend in packets dropped due to the effective rate limit. |
Host <Index> Packets Blocked | Trend in packets blocked due to related blocking periods. |
HTTP Referers | |
Referer <Index> Max Packet Rate | Trend in observed maximum packet rate of packets with the specified Referer header. A spike in this graph shows a possible Referer flood. |
Referer <Index> Packets Dropped | Trend in packets dropped due to the effective rate limit. |
Referer <Index> Packets Blocked | Trend in packets blocked due to related blocking periods. |
HTTP Cookies | |
Cookie <Index> Max Packet Rate | Trend in observed maximum packet rate of packets with the specified cookie header. A spike in this graph shows a possible Cookie flood. |
Cookie <Index> Packets Dropped | Trend in packets dropped due to the effective rate limit. |
Cookie <Index> Packets Blocked | Trend in packets blocked due to related blocking periods. |
HTTP User Agents | |
User Agents <Index> Max Packet Rate | Trend in observed maximum packet rate of packets with the specified user agent header. A spike in this graph shows a possible User Agent flood. |
User Agents <Index> Packets Dropped | Trend in packets dropped due to the effective rate limit. |
User Agents <Index> Packets Blocked | Trend in packets blocked due to related blocking periods. |