Using the Flood Drops Layer 7 graphs
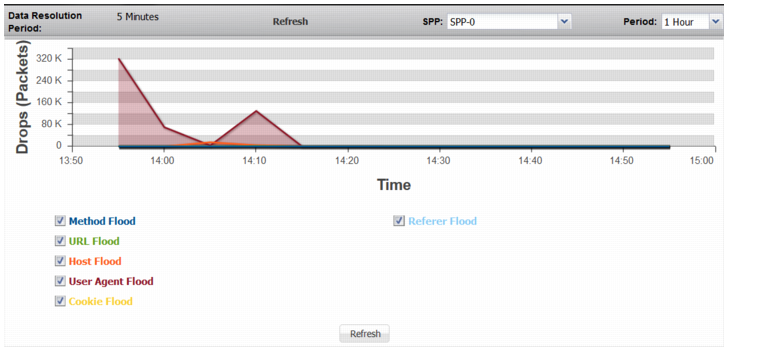
You use the Flood Drops graphs to monitor drops due to SPP thresholds that detect flood attacks. A URL flood is the example of a Layer 7 flood. In this attack, a single URL is continuously attacked from multiple sources.
Table 40 summarizes the statistics displayed in the Flood Drops: Layer 7 graph.
Figure 53 shows the graph.
You can customize the following query terms: SPP and period.
Before you begin:
• You must have Read-Write permission for Log & Report settings.
To display the graphs:
• Go to Monitor > Flood Drops > Layer 7.
Table 40: Flood Drops: Layer 7
Statistic | Description |
Method Flood | Aggregation of drops due to the thresholds for HTTP Methods. To view statistics for a specific method, go to Monitor > Layer 7 > HTTP Methods. |
URL, Host, User Agent, Cookie, and Referer Flood | Aggregation of drops due to thresholds for URLs or Host, User Agent, Cookie, or Referer headers. To view statistics for a specific URL or header field, go to Monitor > Layer 7 and select the appropriate graph. |


