Figure 71: SYN Packets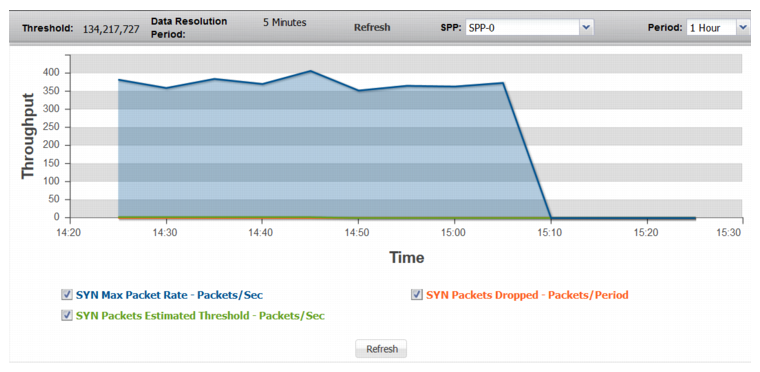
Statistic | Description |
SYN Packets | |
SYN Max Packet Rate | Trend in observed maximum packet rate (SYN packets/second). |
SYN Packets Estimated Threshold | Trend in the estimated threshold. The estimated threshold is the rate that triggers drops. In contrast to the configured minimum threshold, which is based on a snapshot of previously recorded data, the estimated threshold adjusts as more traffic is observed. It is almost always higher than the configured minimum threshold, and never lower. It is based on algorithms designed to distinguish attack traffic from traffic increases that are the result of legitimate users accessing the protected system. Factors include historical data, trend, and seasonality. |
SYN Packets Dropped | Trend in drops due to the effective rate limit for the syn threshold. |
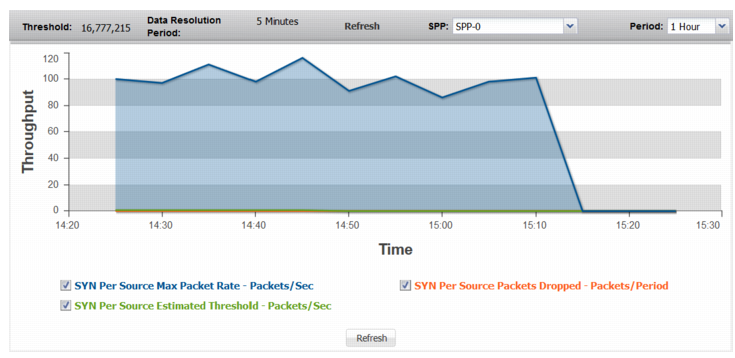
SYN Per Source | |
SYN Per Source Max Packet Rate | Trend in observed maximum rate of SYN packets from a single source. A spike in this graph shows a possible SYN attack from a single source or a few sources. |
SYN Per Source Estimated Threshold | Trend in the estimated threshold. |
SYN Per Source Packets Dropped | Trend in drops due to the effective rate limit for the syn-per-source threshold. |
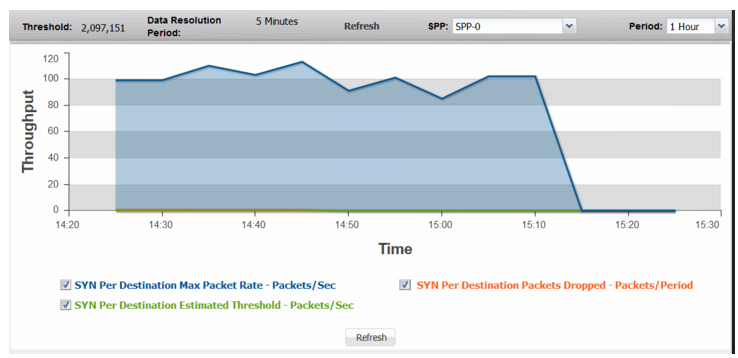
SYN Per Destination | |
SYN Per Destination Max Packet Rate | Trend in observed maximum rate of SYN packets to a single destination. A spike in this graph shows a possible SYN attack on a single destination or a few destinations. |
SYN Per Destination Estimated Threshold | Trend in the estimated threshold. |
SYN Per Destination Drops | Trend in drops due to the effective rate limit for the syn-per-dst threshold. |
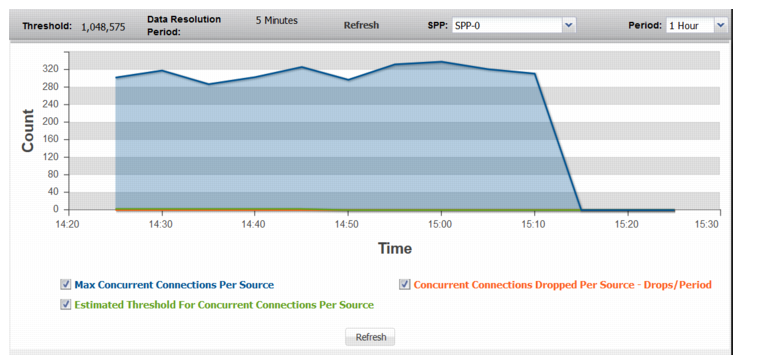
Connections Per Source | |
Max Concurrent Connections Per Source | Trend in observed count of concurrent connections for the busiest source. A spike in this graph shows that a single source may be trying to establish too many connections. |
Estimated Threshold for Concurrent Connections Per Source | Trend in the estimated threshold. |
Concurrent Connections Dropped Per Source | Trend in drops due to the effective rate limit for the concurrent-connections-per-source threshold. |
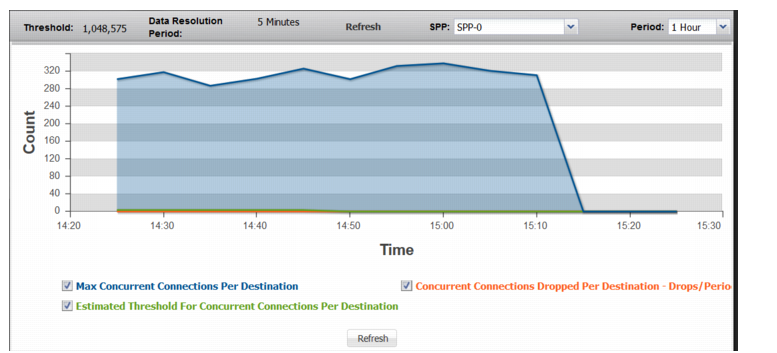
Connections Per Destination | |
Max Concurrent Connections Per Destination | Trend in observed count of concurrent connections for the busiest destination. A spike in this graph shows a possible DDoS attack on a single destination. |
Estimated Threshold For Concurrent Connections Per Destination | Trend in the estimated threshold. |
Concurrent Connections Dropped Per Destination | Trend in drops due to the effective rate limit for the concurrent-connections-per-destination threshold. |
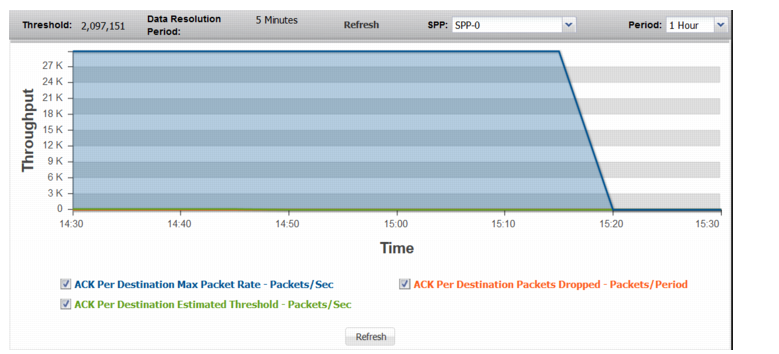
ACK Per Destination | |
ACK Per Destination Max Packet Rate | Trend in observed maximum rate of ACK packets to a single destination. A spike in this graph shows a possible ACK attack on a single destination or a few destinations. |
ACK Per Destination Estimated Threshold | Trend in the estimated threshold. |
ACK Per Destination Dropped | Trend in drops due to the effective rate limit for the ack-per-dst threshold. |
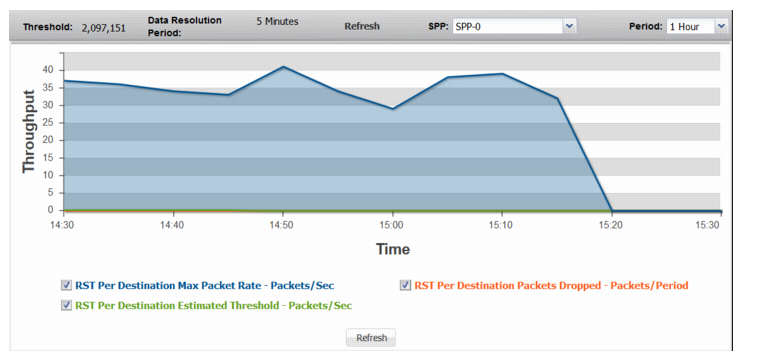
RST Per Destination | |
RST Per Destination Max Packet Rate | Trend in observed maximum rate of RST packets to a single destination. A spike in this graph shows a possible RST attack on a single destination or a few destinations. |
RST Per Destination Estimated Threshold | Trend in the estimated threshold. |
RST Per Destination Packets Dropped | Trend in drops due to the effective rate limit for the rst-per-dst threshold. |
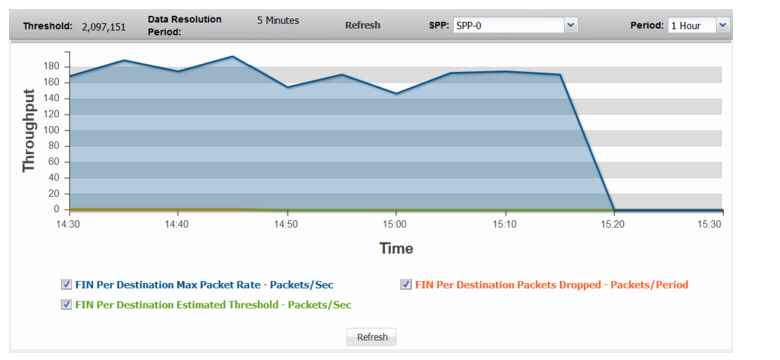
FIN Per Destination | |
FIN Per Destination Max Packet Rate | Trend in observed maximum rate of FIN packets to a single destination. A spike in this graph shows a possible FIN attack on a single destination or a few destinations. |
FIN Per Destination Estimated Threshold | Trend in the estimated threshold. |
FIN Per Destination Packets Dropped | Trend in drops due to the effective rate limit for the fin-per-dst threshold. |
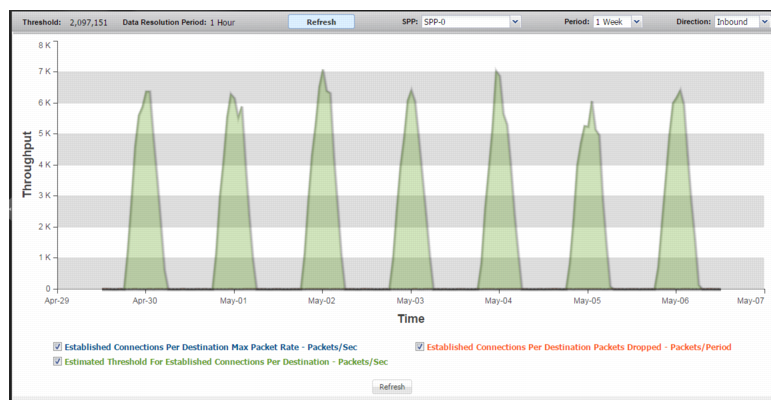
ESTAB Per Destination | |
Established Connections Per Destination Max Packet Rate | Trend in observed packet rate for the destination with the most established TCP connections. A spike in this graph shows a possible connection establishment attack. |
Estimated Threshold For Established Connections Per Destination | Trend in the estimated threshold. |
Established Connections Per Destination Packets Dropped | Trend in drops due to the effective rate limit for the estab-per-dst threshold. |
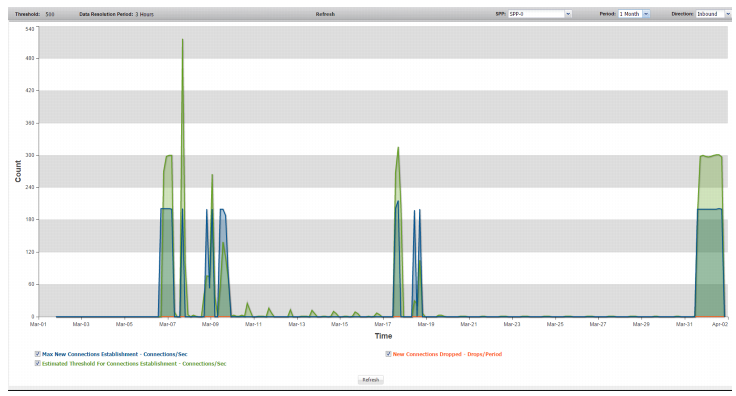
New Connections | |
Max New Connections Establishment | Trend in observed packet rate of new connections. A spike in this graph shows a possible concerted DoS or DDoS attack. |
Estimated Threshold for Connections Establishment | Trend in the estimated threshold. |
New Connections Dropped | Trend in drops due to the effective rate limit for the new-connections threshold. |
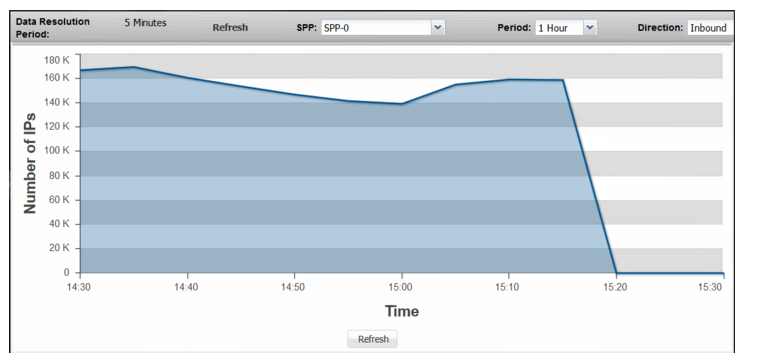
Non-Spoofed IPs | |
Non-Spoofed IPs | Trend in count of entries in the legitimate IP address table. Note: The legitimate IP address table is maintained and reported as a global count. (Please disregard the SPP selection menu on this page.) Therefore, the Non-Spoofed IPs graph is not reset when you reset SPP statistics. |
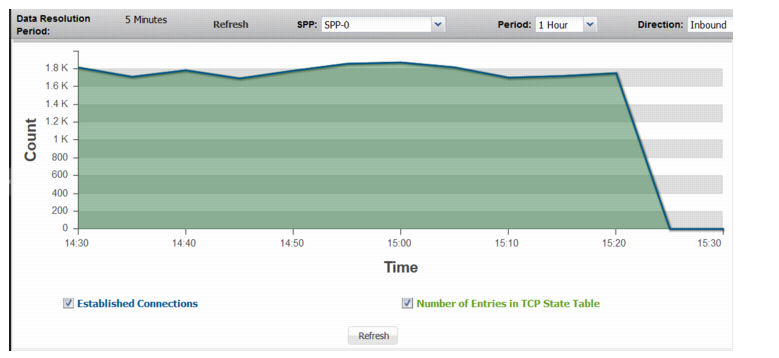
Established Connections | |
Established Connections | Trend in count of entries in the TCP state table that are in the established state (completed three-way handshake). |
Number of Entries in TCP State Table | Trend in count of entries in the TCP state table, including half-open connections. If the values for the number of entries in the TCP state table are significantly higher than those for established connections, it shows a possible SYN flood attack. |
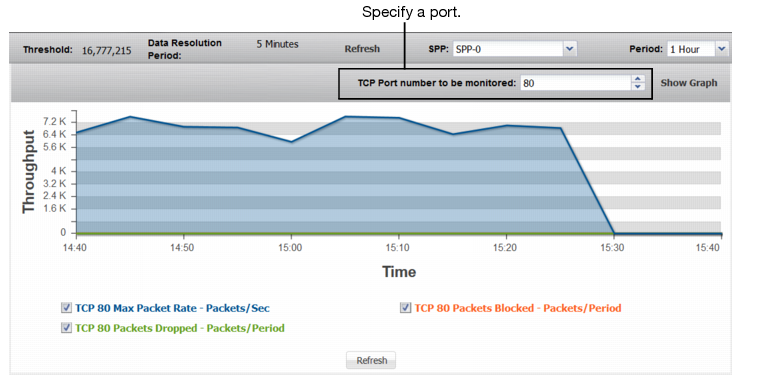
TCP Ports | |
TCP <Port> Max Packet Rate | Trend in observed maximum packet rate to the specified port. A spike in this graph shows a possible port flood. |
TCP <Port> Packets Dropped | Trend in packets dropped due to the effective rate limit. |
TCP <Port> Packets Blocked | Trend in packets blocked due to related blocking periods. |
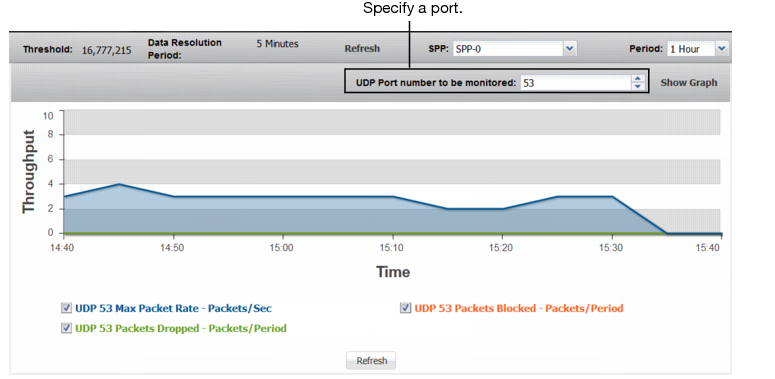
UDP Ports | |
UDP <Port> Max Packet Rate | Trend in observed maximum packet rate to the specified port. A spike in this graph shows a possible port flood. |
UDP <Port> Packets Dropped | Trend in packets dropped due to the effective rate limit. |
UDP <Port> Packets Blocked | Trend in packets blocked due to related blocking periods. |
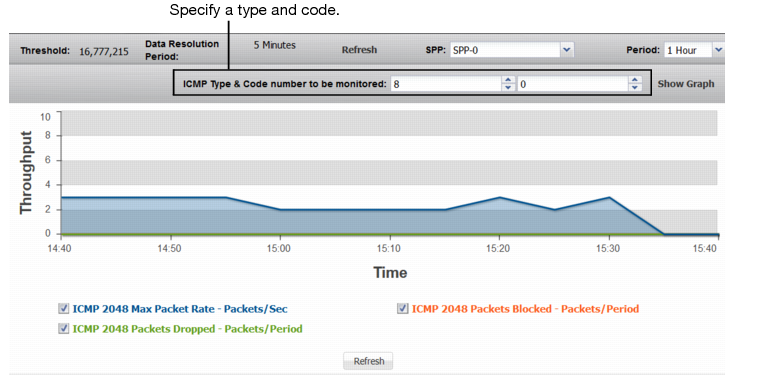
ICMP Types/Codes | |
ICMP <Index> Max Packet Rate | Trend in observed maximum packet rate of packets with the specified ICMP type/code. A spike in this graph shows a possible ICMP flood. |
ICMP <Index> Packets Dropped | Trend in packets dropped due to the effective rate limit. |
ICMP <Index> Packets Blocked | Trend in packets blocked due to related blocking periods. |