Figure 65: Most Active Source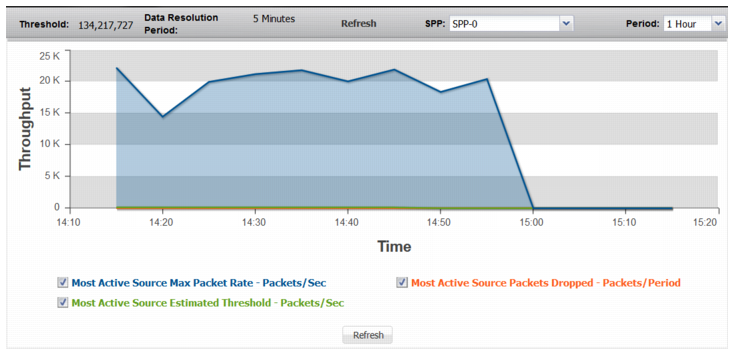
Statistic | Description |
Most Active Source | |
Most Active Source Max Packet Rate | Trend in observed packet rate of the most active source address. Note that this is not necessarily a graph of the same source over time, but rather a trend of the rate for the most active source during each sampling period. |
Most Active Source Estimated Threshold | Trend in the estimated threshold. The estimated threshold is the rate that triggers drops. In contrast to the configured minimum threshold, which is based on a snapshot of previously recorded data, the estimated threshold adjusts as more traffic is observed. It is almost always higher than the configured minimum threshold, and never lower. It is based on algorithms designed to distinguish attack traffic from traffic increases that are the result of legitimate users accessing protected resources. Factors include historical data, trend, and seasonality. |
Most Active Source Packets Dropped | Trend in drops due to the effective rate limit for the most-active-source threshold. |
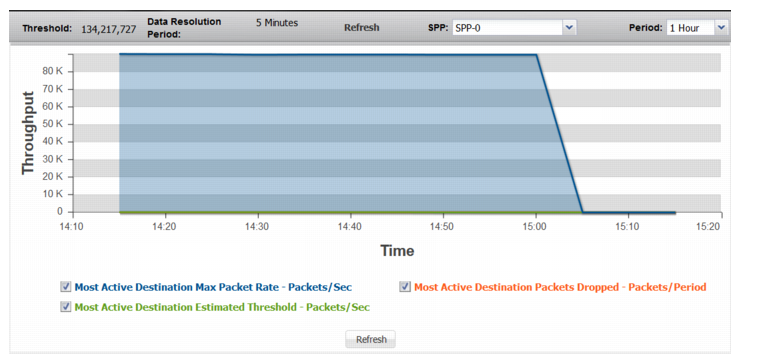
Most Active Destination | |
Most Active Destination Max Packet Rate | Trend in observed packet rate of the most active destination address. Note that this is not necessarily a graph of the same destination over time, but rather a trend of the rate for the most active destinations during each sampling period. |
Most Active Destination Estimated Threshold | Trend in the estimated threshold. |
Most Active Destination Packets Dropped | Trend in drops due to the effective rate limit for the most-active-destination threshold. |
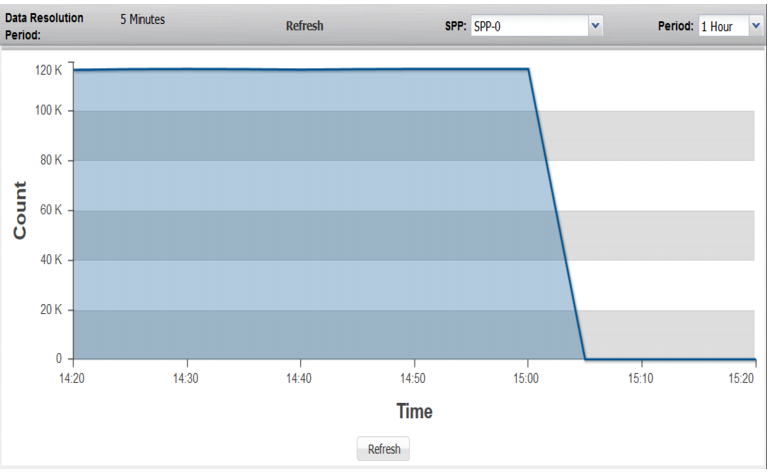
Count of Unique Sources | |
Count of Unique Sources | Trend in the count of unique source IP addresses in the session table. A spike in this graph indicates a possible DDoS attack. |
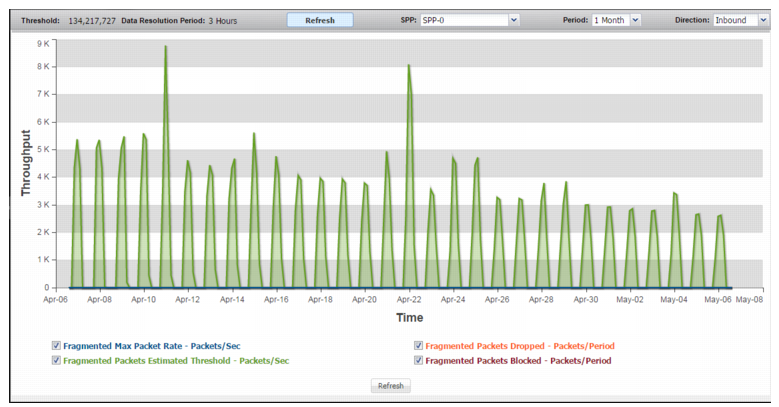
Fragmented Packets | |
Fragmented Max Packet Rate | Trend in observed packet rate of fragmented packets. |
Fragmented Packets Estimated Threshold | Trend in the estimated threshold. |
Fragmented Packets Dropped | Trend in drops due to the effective rate limit for the fragment threshold. |
Fragmented Packets Blocked | Trend in drops due to blocking periods that were triggered when the system detected an attack based on the fragment counter. |
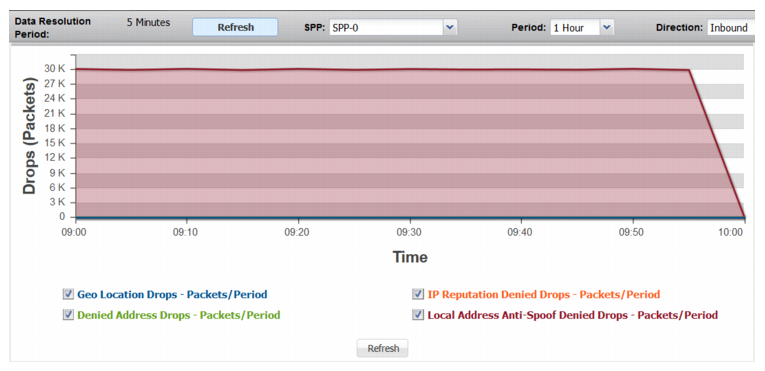
Address Denied | |
Geolocation Drops | Trend in drops due to global ACL rules that deny traffic from specified Geolocations. |
Denied Address Drops | Trend in drops due to global ACL rules or SPP ACL rules that deny traffic from specified IP addresses. |
IP Reputation Drops | Trend in drops due to IP Reputation rules. |
Local Address Anti-Spoof Denied Drops | Trend in drops due to global anti-spoofing rules. |
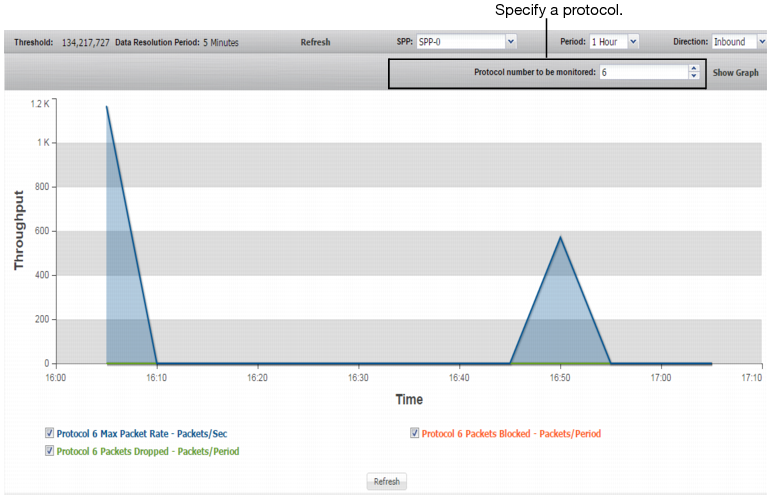
Protocols | |
Protocol <Number> Max Packet Rate | Trend in observed packet rate for the specified protocol. A spike in this graph shows a possible protocol flood. |
Protocol <Number> Packets Dropped | Trend in packets dropped due to the effective rate limit. |
Protocol <Number> Packets Blocked | Trend in packets blocked due to related blocking periods. |