Using the Executive Summary dashboard
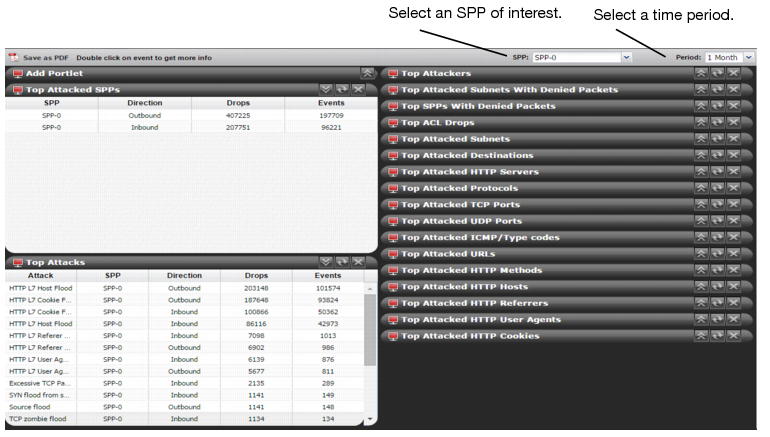
Figure 117 shows the Executive Summary dashboard. A dashboard is a palette containing portlets. Each portlet contains a table report that summarizes top attacks ranked by drop count (highest to lowest). The data is filtered by SPP, so this dashboard gives you insight into the attacks that have been thwarted by that SPP’s security posture.
The following attack reports are available:
• Top Attacked SPPs—Drop and Event counts by SPP.
• Top SPPs with Denied Packets—ACL drop count by SPP.
• Top Attacked Subnets with Denied Packets—ACL drop count by subnet ID.
• Top Attacks—Drop count by DDoS attack type.
• Top ACL Drops—Drop count by ACL rules.
• Top Attacked Subnets—Drop count by subnet ID.
• Top Attacked Destinations—Drop count by Destination IP address.
• Top Attackers—Drop count by Source IP address.
• Top Attacked Protocols—Drop count by protocol.
• Top Attacked TCP Ports—Drop count by TCP port.
• Top Attacked UDP Ports—Drop count by UDP port.
• Top Attacked ICMP Type Codes—Drop count by ICMP type code.
• Top Attacked HTTP Methods—Drop count by HTTP method.
• Top Attacked URLs—Drop count by HTTP URL (hash index).
• Top Attacked HTTP Referers—Drop count by Referer header (hash index).
• Top Attacked HTTP Cookies—Drop count by Cookie header (hash index).
• Top Attacked HTTP Hosts—Drop count by Host header (hash index).
• Top Attacked HTTP User Agents—Drop count by User-Agent header (hash index).
• Top Attacked HTTP Servers—Drop count by HTTP server IP address.
To display the Executive Summary dashboard:
1. Go to Log & Report > Report Browse > Executive Summary.
2. Select the SPP of interest and a time period.
You can customize the portlets that are displayed on the dashboard, where they are located on the page, and whether they are minimized or maximized.
To display a portlet that is not currently displayed, expand the Add Portlet portlet and select the portlet that you want to add.
To move a portlet, drag its title bar to a new location.