Using the System Status dashboard
The System Status dashboard is a palette containing portlets. Each portlet contains a table or graph summary of system information or system status.
You use the dashboard to check system status at-a-glance or to quickly find system information, like the hardware serial number, firmware version, license status, or interface status. For a deeper look at attack traffic, use the Monitor and Log & Report menus.
Before you begin:
• You must have Read-Write permission for Log & Report settings.
To display the System Status dashboard:
• Go to System > Status > Dashboard.
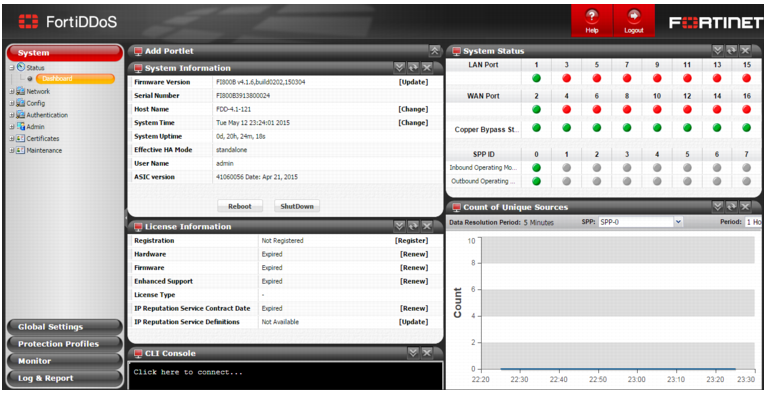
Figure 106 shows the System Status dashboard.
Customizing the dashboard
The default dashboard setup includes the following portlets:
• Add Portlet portlet
• System Information portlet
• License Information portlet
• System Status portlet
• System Resources portlet
• CLI Console portlet
• Top SPPs with Denied Packets portlet
• Top Attacked SPPs portlet
You can customize the portlets that are displayed on the dashboard, where they are located on the page, and whether they are minimized or maximized.
To display a portlet that is not currently displayed, expand the Add Portlet portlet and select the portlet that you want to add.
To move a portlet, drag its title bar to a new location.
System Information portlet
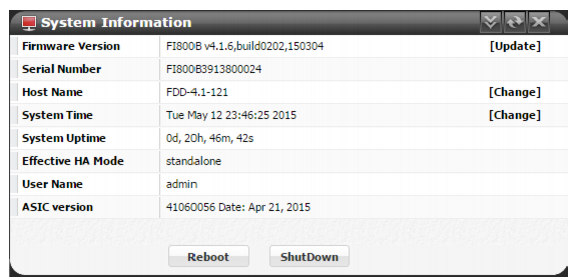
Figure 108 shows the System Information portlet. It displays basic information, such as the firmware version, serial number, hostname, and system time.
License Information portlet
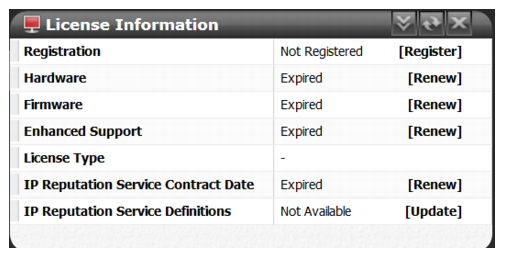
Figure 109 shows the License Information portlet. It displays license and registration status, including status for the FortiGuard IP Reputation Service.
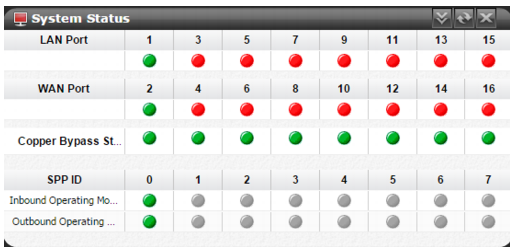
System Status portlet
Figure 110 shows the System Status portlet. It displays status for network interfaces, bypass, and SPPs.
Table 108 describes the status indicators.
Table 67: System Status portlet
Category | Status Indicators |
Port | Green icon - The port is physically connected the network. Red icon - The port has no physical connection to the network. Odd-numbered ports are LAN connections that have a corresponding even-numbered port, which is the associated WAN connection. (For example, Port 1 connected to the Ethernet and Port 2 connected to the Internet). Hover over the status icons to see additional information: port number, link status, speed, auto-negotiation, and medium (copper or fiber). |
Bypass State | Used for copper-based (RJ-45) Ethernet connections only. Green icon - Normal operation (no bypass). Red icon - Link is operating in bypass mode. |
SPP ID | Green icon - Profile is operating in Detection Mode (monitoring traffic to generate statistics). Red icon - Profile is operating in Prevention Mode (dropping or blocking attacks as well as generating statistics). Gray icon - Profile is not configured. Hover over the status icons to see additional information: port number, ID, name, mode. |
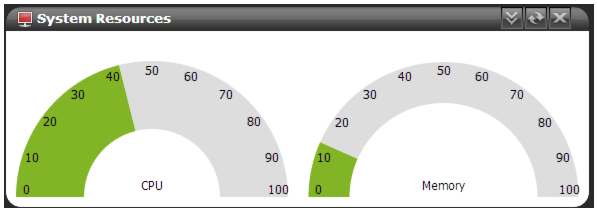
System Resources portlet
Figure 111 shows the System Resources portlet. It displays CPU and memory usage as a dial gauge and as a percentage of the usage for core processes only. CPU and memory usage for management processes (for example, for HTTPS connections to the web UI) is excluded.
This portlet does not display disk usage.To view disk space information, connect to the CLI and enter the following command:
diagnose hardware get sysinfo df
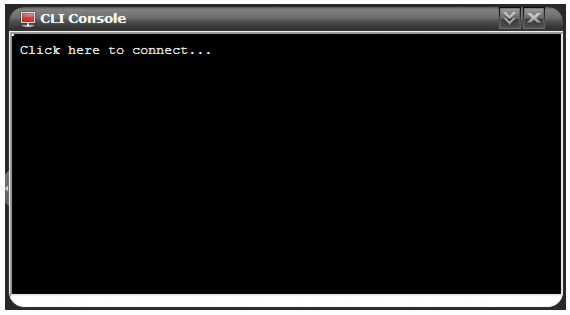
CLI Console portlet
Figure 109 shows the CLI Console portlet. It enables you to enter CLI commands through the web UI, without making a separate Telnet, SSH, or local console connection.
To use the console, click in the console area. You are logged in as the same admin account you used to access the web UI.
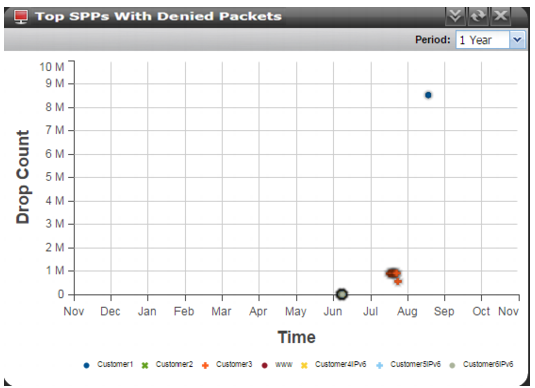
Top SPPs with Denied Packets portlet
Figure 113 shows the Top SPPs with Denied Packets portlet. It displays the trend in drop count for traffic that has been dropped by Global ACL rules or SPP ACL rules.
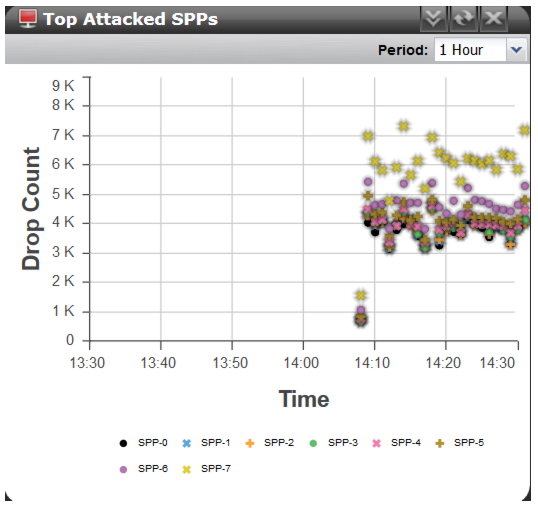
Top Attacked SPPs portlet
Figure 114 shows the Top Attacked SPPs portlet. It displays the trend in drop count for traffic that has been dropped by SPP threshold rules.
To hide or display the count for an SPP, click its name.
To display details, hover over a point on the graph.
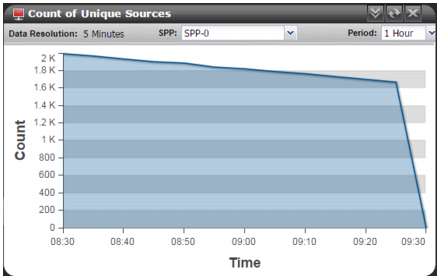
Unique Sources portlet
Figure 115 shows the Unique Sources portlet. It displays the trend in the unique Source IP count for the selected SPP and time period. A spike in this graph indicates a possible DDoS attack.
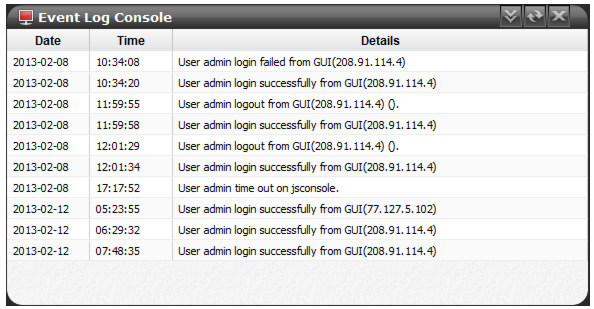
Event Log Console portlet
Figure 116 shows the Event Log Console portlet. Event logs help you track system events, such as administrator logins and firmware changes.