Working with the FortiDDoS Monitor graphs
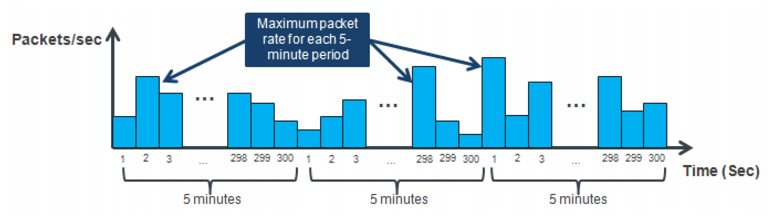
The FortiDDoS system records data points for monitored thresholds every five minutes. The data point is the highest rate observed in any one second during the five minute window.
Figure 21 illustrates this.
The FortiDDoS graphs are plots of data points. The reporting framework uses resolution periods to fit data points in time-based graphs. In a graph with a five minute resolution period, the graph is based on a plot of the rates or counts recorded for the regular five minute window. In a graph with a one hour resolution period, the graph is based on a plot of the rates or counts for the highest rate among the points recorded in a one hour window—in other words, the highest rate among the 12 five minute windows reported in the hour.
Table 11 lists resolution periods used for report periods.
Table 11: Data resolution periods
Graph Period | Resolution Period |
1 hour | 5 minutes |
8 hours | 5 minutes |
1 day | 5 minutes |
1 week | 1 hour |
1 month | 3 hours |
1 year | 45 hours |
Note: The data displayed in a graph is current as of the time the last data point was written. For example, a 1-hour graph with a 5-minute resolution is current as of the time the last 5-minute resolution data point was stored. Traffic in the most recent 0-5 minutes might not have been registered yet. Similarly, for a 1-year graph with a data resolution of 45 hours, data for the last 0-45 hours might not have been registered yet.