Using the Flood Drops Aggregate graphs
You use the Flood Drops graphs to monitor drops due to SPP thresholds that detect flood attacks.
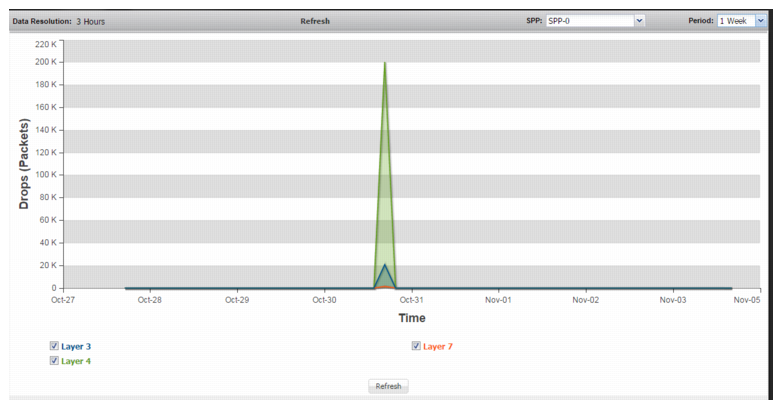
Table 38 summarizes the statistics displayed in the Flood Drops: Aggregate graph.
Figure 50 shows the graph.
You can customize the following query terms: SPP and period.
Before you begin:
• You must have Read-Write permission for Log & Report settings.
To display the graphs:
• Go to Monitor > Flood Drops > Aggregate.
Table 37: Flood Drops: Aggregate
Statistic | Description |
Layer 3 | An aggregation of drops due to SPP Layer 3 thresholds. |
Layer 4 | An aggregation of drops due to SPP Layer 4 thresholds. |
Layer 7 | An aggregation of drops due to SPP Layer 7 thresholds. |