Using the Aggregate Drops graph
You use the Aggregate Drops graph to monitor the trend in drops over time.
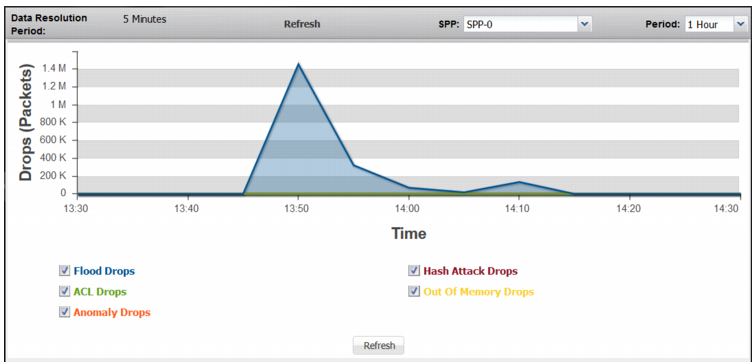
The Aggregate Drops graph plots the following data:
• Flood Drops—Aggregate of drops due to thresholds that detect floods.
• ACL Drops—Aggregate of drops due to ACL rules.
• Anomaly Drops—Aggregate of drops due to built-in and user-enabled anomaly detection methods.
• Hash Attack Drops—Aggregate of drops due to built-in rules that detect hash attacks on the FortiDDoS system itself.
• Out of Memory Drops—Aggregate of drops due to built-in rules that detect memory attacks on the FortiDDoS system itself.
Figure 49 shows the Aggregate Drops graph.
You can customize the following query terms: SPP, period.
Before you begin:
• You must have Read-Write permission for Log & Report settings.
To display the graphs:
• Go to Monitor > Aggregate Drops > Aggregate.