Managing baseline traffic statistics
This section includes the following information:
Baseline traffic statistics overview
The baseline traffic statistics are the maximum value (rate or count) measured by the counter during the observation period. The system saves data points every five minutes. During a 1-hour period, for example, there are 12, 5-minute observation periods. FortiDDoS saves a data point for each 5-minute interval. If you choose a 1-hour period, the system generates the maximum value across these 12 periods of 5-minute intervals.
The baseline statistics are used to establish the configured minimum threshold and ultimately the absolute maximum rate limit.
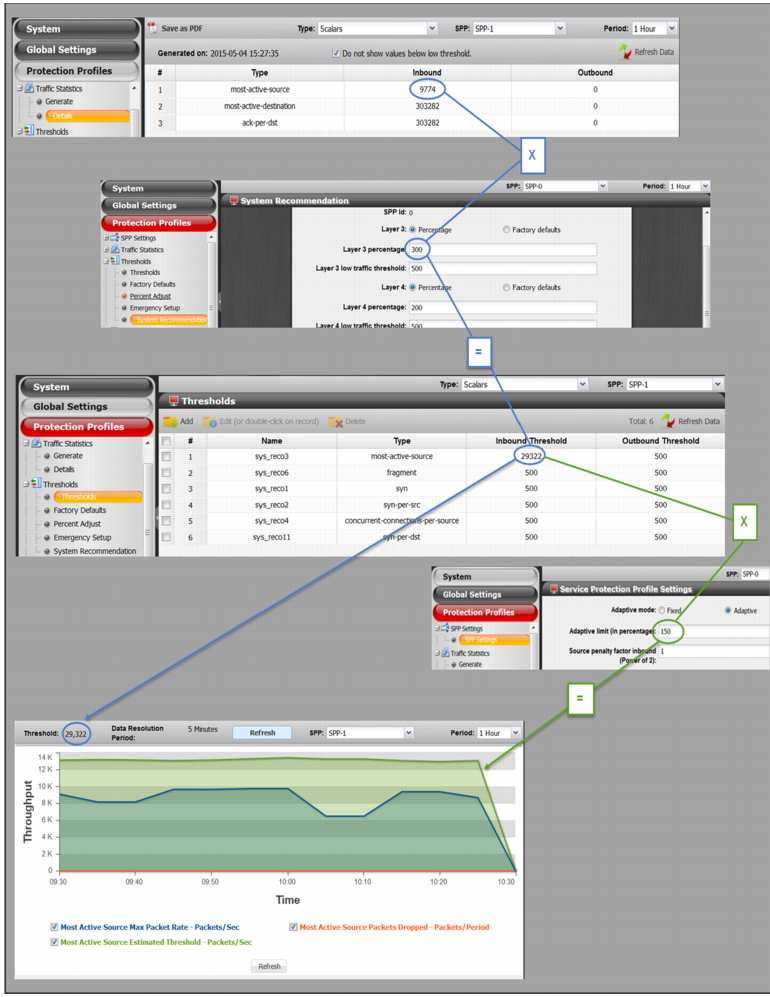
Figure 44 illustrates the relationship between the baseline statistics, threshold settings, and monitor graphs.
1. The generated baseline statistic for the most-active-source threshold is 9774 packets/second.
2. The generated baseline statistic is multiplied by the Layer 3 percentage adjustment on the System Recommendation page. The default is 300%.
3. The product of the baseline and the percentage adjustment determines the configured minimum threshold. 9774x 300% = 29322 packets/second.
4. The configured minimum threshold is displayed on its monitor graph.
5. On the monitor graph, the estimated threshold is the top line. The estimated threshold can go no higher than the product of the configured minimum threshold and the adaptive limit. 29322 * 150% = 43983 packets/second.