Getting Started : Step 8: Monitor the system and become familiar with logs and reports
Step 8: Monitor the system and become familiar with logs and reports
For your initial deployment, continue to use Detection Mode for a day or two during which you review logs for potential false positives and false negatives.
Basic steps
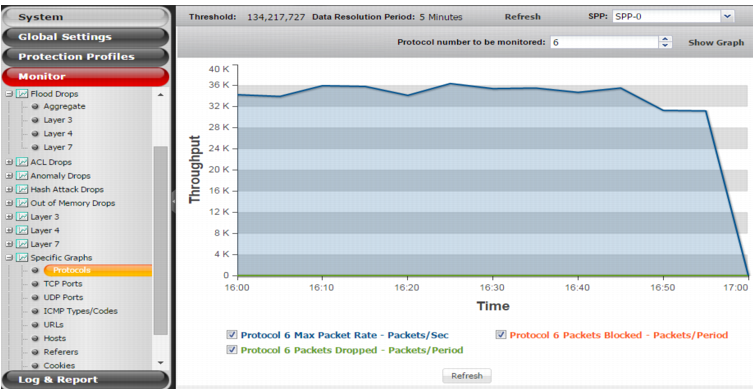
1. Go to the Monitor menu and review throughput rates. Start with aggregate graphs and then use the more detailed graphs to drill in on patterns of interest or concern.
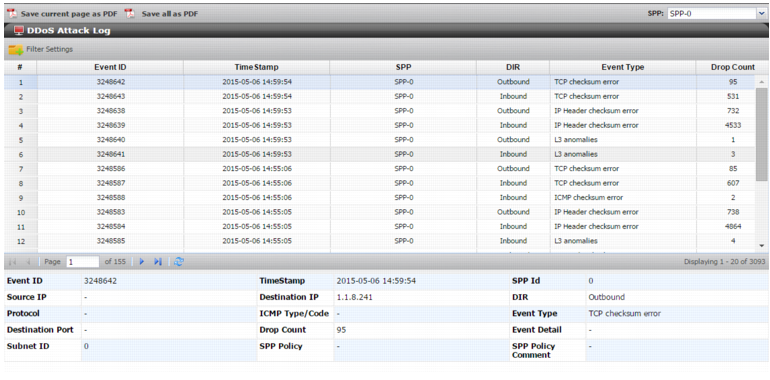
2. Go to Log & Report > Log Access > DDoS Attack Log and become familiar with the log table and how to use log filters.
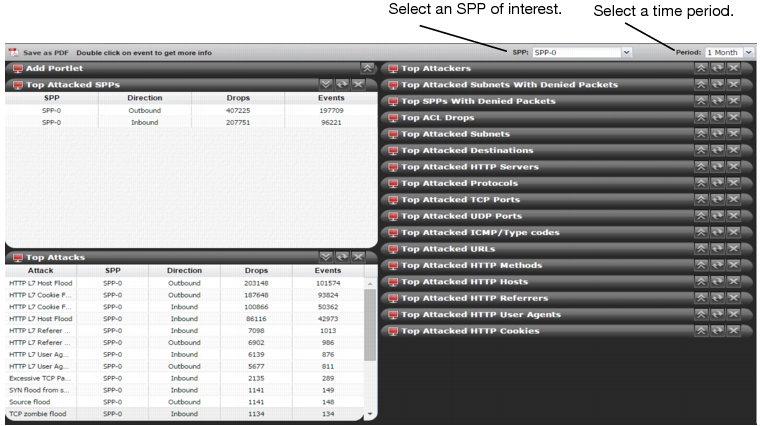
3. Go Log & Report > Report Browse > Executive Summary and become familiar with the Executive Summary dashboard.
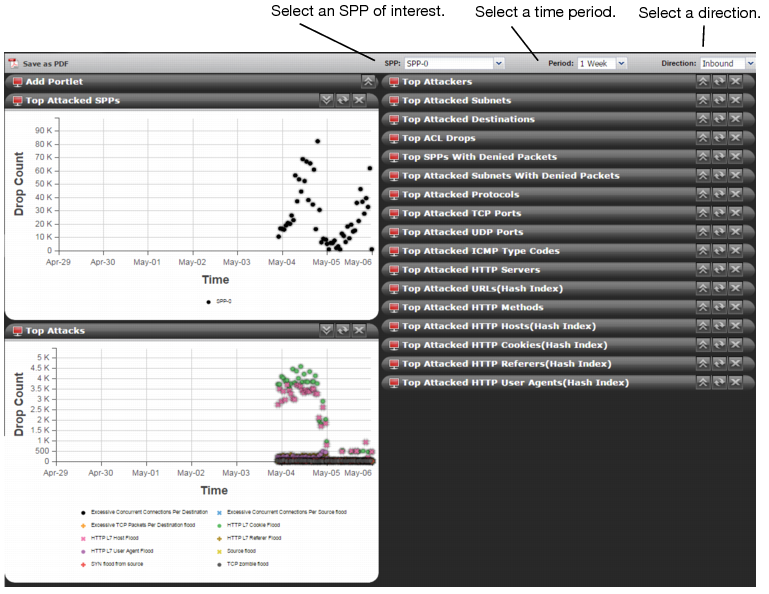
4. Go Log & Report > Attack Graphs and become familiar with the Attack Graphs dashboard.
For details, refer to the online help or see
“Using Traffic Monitor Graphs”.
For details, refer to the online help or see
“Using the DDoS Attack Log table”.
For details, refer to the online help or see
“Using the Executive Summary dashboard”.
For details, refer to the online help or see
“Using the Attack Graph dashboard”.