Figure 91: SNMP basic configuration page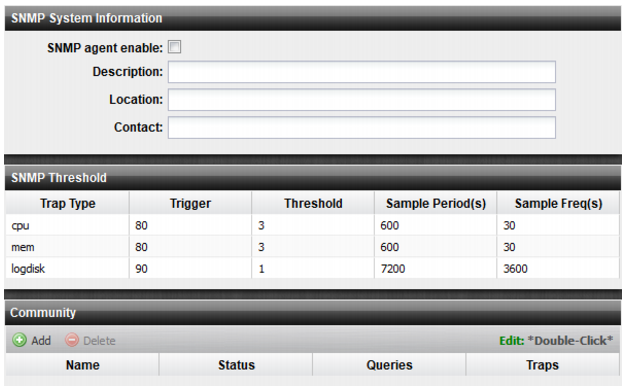
Fortinet strongly recommends that you do not add FortiDDoS to the community named public. This popular default name is well-known, and attackers that gain access to your network will often try this name first. |
Test both traps and queries (assuming you have enabled both). Traps and queries typically occur on different port numbers, and therefore verifying one does not necessarily verify that the other is also functional. To test queries, from your SNMP manager, query the FortiDDoS appliance. To test traps, cause one of the events that should trigger a trap. |
Settings | Guidelines |
SNMP System Information | |
SNMP Agent | Enable to activate the SNMP agent, so that the system can send traps and receive queries. |
Description | A description or comment about the system, such as dont‑reboot. The description can be up to 35 characters long, and can contain only letters (a-z, A-Z), numbers, hyphens ( ‑ ) and underscores ( _ ). |
Location | Physical location of the appliance, such as floor2. The location can be up to 35 characters long, and can contain only letters (a-z, A-Z), numbers, hyphens ( ‑ ) and underscores ( _ ). |
Contact | Contact information for the administrator or other person responsible for this system, such as a phone number (555-5555) or name (jdoe). The contact information can be up to 35 characters long, and can contain only letters (a-z, A-Z), numbers, hyphens ( ‑ ) and underscores ( _ ). |
SNMP Threshold | |
CPU | • Trigger—The default is 80% utilization. • Threshold—The default is 3, meaning the event is reported when the condition has been triggered 3 times in a short period. • Sample Period—The default is 600 seconds. • Sample Frequency—The default is 30 seconds. |
Memory | • Trigger—The default is 80% utilization. • Threshold—The default is 3, meaning the event is reported when the condition has been triggered 3 times in a short period. • Sample Period—The default is 600 seconds. • Sample Frequency—The default is 30 seconds. |
Log disk usage | • Trigger—The default is 90% utilization. • Threshold—The default is 1, meaning the event is reported each time the condition is triggered. • Sample Period—The default is 7200 seconds. • Sample Frequency—The default is 3600 seconds. |
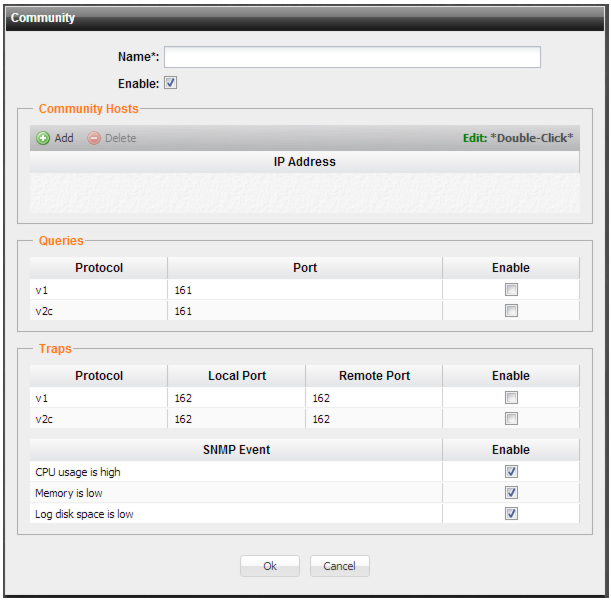
SNMP Community | |
Name | Name of the SNMP community to which the FortiDDoS system and at least one SNMP manager belongs, such as management. You must configure the FortiDDoS system to belong to at least one SNMP community so that community’s SNMP managers can query system information and receive SNMP traps. You can add up to three SNMP communities. Each community can have a different configuration for queries and traps, and the set of events that trigger a trap. You can also add the IP addresses of up to eight SNMP managers to each community to designate the destination of traps and which IP addresses are permitted to query the FortiDDoS system. |
Enable | Select to enable the configuration. |
Community Hosts | IP address of the SNMP manager to receive traps and be permitted to query the FortiDDoS system. SNMP managers have read-only access. You can add up to 8 SNMP managers to each community. To allow any IP address using this SNMP community name to query the FortiDDoS system, enter 0.0.0.0. For security best practice reasons, however, this is not recommended. Caution: The system sends security-sensitive traps, which should be sent only over a trusted network, and only to administrative equipment. Note: If there are no other host IP entries, entering only 0.0.0.0 effectively disables traps because there is no specific destination for trap packets. If you do not want to disable traps, you must add at least one other entry. |
Queries | Port number on which the system listens for SNMP queries from the SNMP managers in this community. The default is 161. Enable queries for SNMP v1, SNMP v2c, or both. |
Traps | Source (Local) port number and destination (Remote) port number for trap packets sent to SNMP managers in this community. The default is 162. Enable traps for SNMP v1, SNMP v2c, or both. |
SNMP Event | Select to enable SNMP event reporting for the following thresholds: • CPU—CPU usage has exceeded 80%. • Memory—Memory (RAM) usage has exceeded 80%. • Log disk usage—Disk space usage for the log partition or disk has exceeded 90%. |