Using the Event Log table
The Event Log table displays logs related to system-wide status and administrator activity.
Table 61 describes the columns in the event log.
Table 61: Event log
Column | Example | Description |
Date | 2015-05-04 | Log date. |
Time | 15:50:37 | Log time. |
Log ID | 1005081 | Log ID. |
Type | event | Log type: event |
Sub Type | config | Log subtype: config, admin, system, ha, update, healthcheck, vserver, router, user, antidos. |
Priority | information | Log level. |
Msg ID | 36609 | Message ID. |
User | admin | User that performed the operation. |
UI | GUI(172.30.153.4) | User interface from which the operation was performed. |
Action | none | Administrator action. |
Msg | "changed settings for 'ddos spp threshold-adjust' on domain 'SPP-0'" | Log message. |
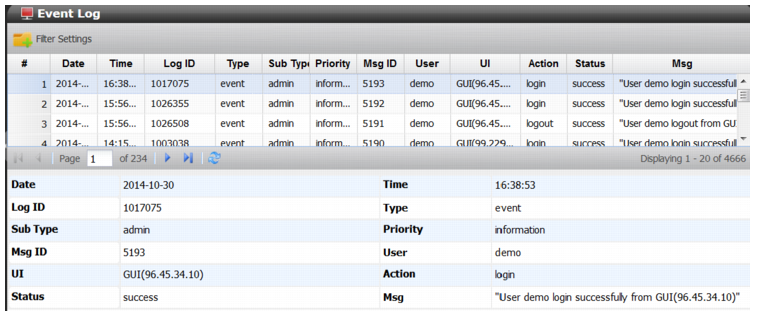
Figure 96 shows the Event Log page. By default, the table displays most recent records first and all columns. You can click a column heading to display controls to sort the rows or show/hide columns.
You click a row to select a record. Log details for the selected event are displayed below the table.
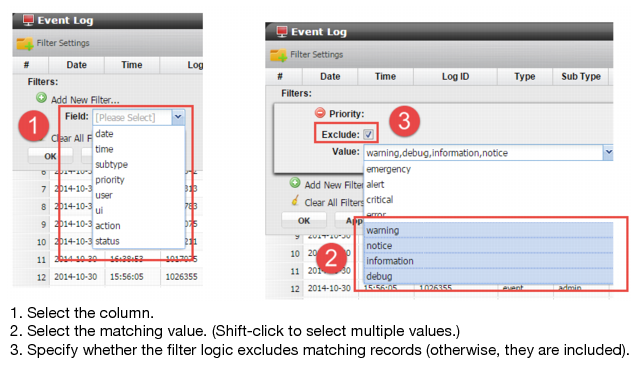
You can use the Filter Settings controls to filter the rows displayed in the table based on event type, severity, action, status, and other values.
Figure 97 shows the Filter Settings controls.
Before you begin:
• You must have Read-Write permission for Log & Report settings.
To view and filter the log:
1. Go to Log & Report > Log Access > Event Log to display the event log.
2. Click Filter Settings to display the filter tools.
3. Use the tools to create filter logic.
4. Click Apply to apply the filter and redisplay the log.