Figure 57: System dashboard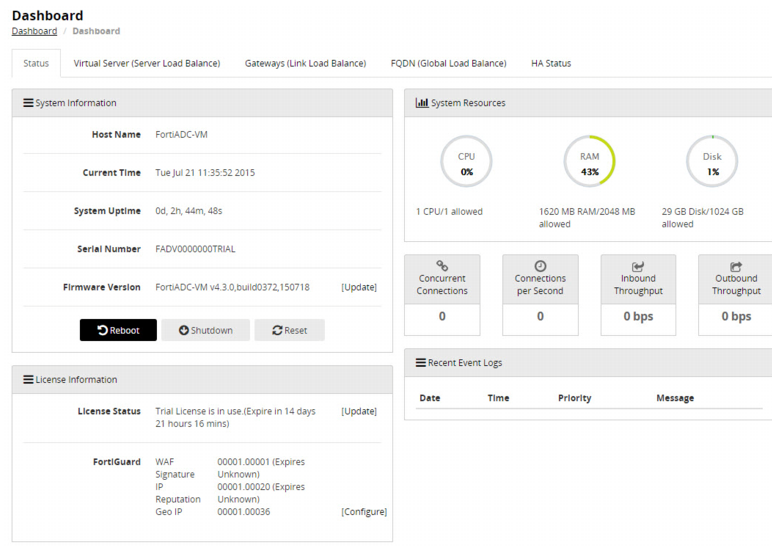
Portlet | Information and Utilities |
Status | |
System Information | Displays: Hostname, current time, system uptime, serial number, firmware version. Operations: Update firmware, upload license, reboot, shutdown, reset. |
System Resources | Displays: CPU utilization, Memory utilization, disk utilization, concurrent connections, connections per second, inbound throughput, outbound throughput. |
License Information | Displays: License status and version information for Fortiguard services. Operations: Upload license, navigate to the FortiGuard services configuration page. |
Recent Event Logs | Tail of the event log. |
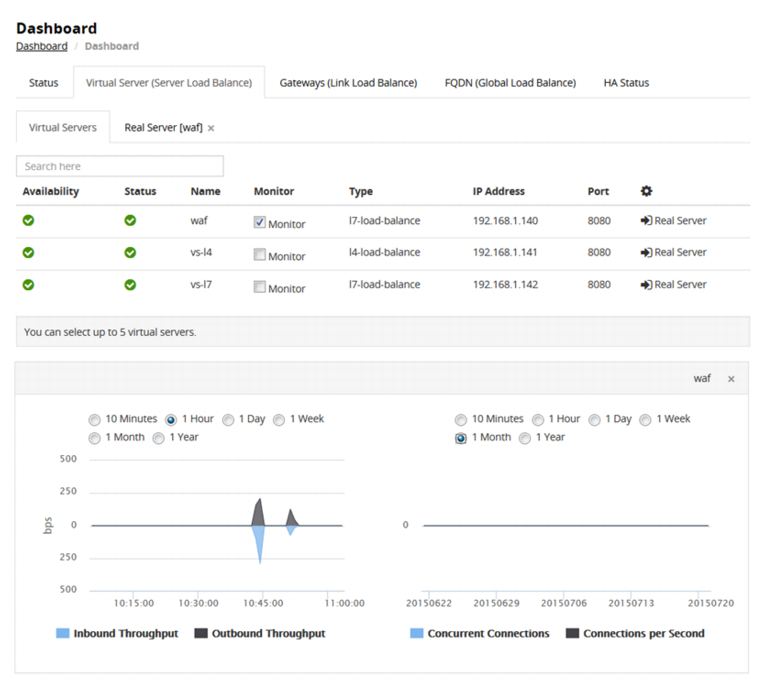
Virtual Servers (Server Load Balance) | |
Virtual Servers | Displays: Status of configured virtual servers. Drill-in: • Select the Monitor checkbox to display throughput and connections graphs. • Click the Real Server link to display status and throughput for the virtual server’s real server pool. |
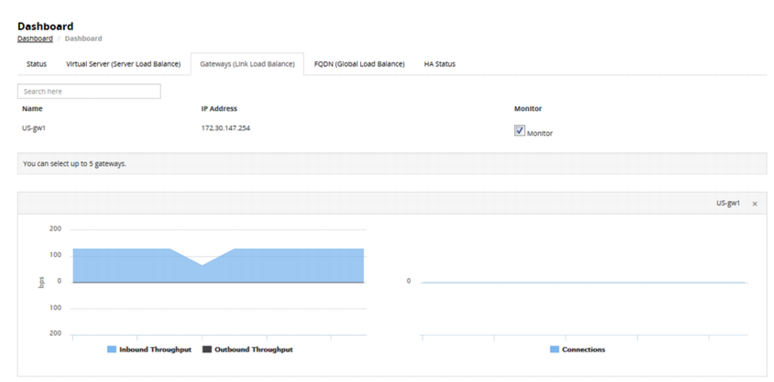
Gateways (Link Load Balance) | |
Gateways | Drill-in: Select the Monitor checkbox to display throughput and session information. |
FQDN (Global Load Balance) | |
DNS responses | Review a table of DNS responses per pool member. |
HA Status | |
HA Status | Displays HA mode and details for HA member nodes. |