Using the Server Load Balance report
The Server Load Balance report is a graph of throughput for the SLB virtual servers with the top throughput.
Before you begin:
• You must have Read-Write permission for Log & Report settings.
To generate a report:
1. Go to Log & Report > Report.
2. Click the Server Load Balance tab.
3. Specify a time range for the report.
4. Select the number of virtual servers to include in the graph.
5. Select whether to use inbound traffic, outbound traffic, or number of sessions as the measure of throughput.
6. Click Search to generate the query.
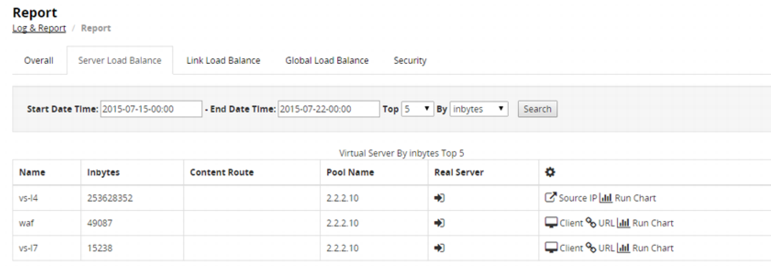
A summary table is displayed. See
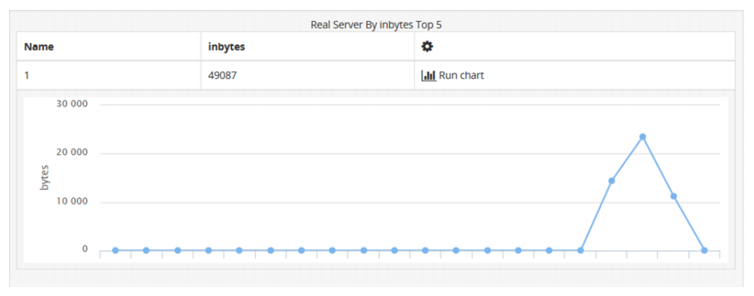
Figure 64.7. Drill into the details for a virtual server by clicking the query links:
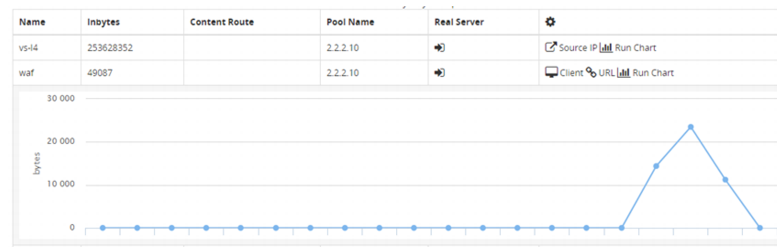
| Generate a report that shows the trend in throughput over time. See Figure 65. |
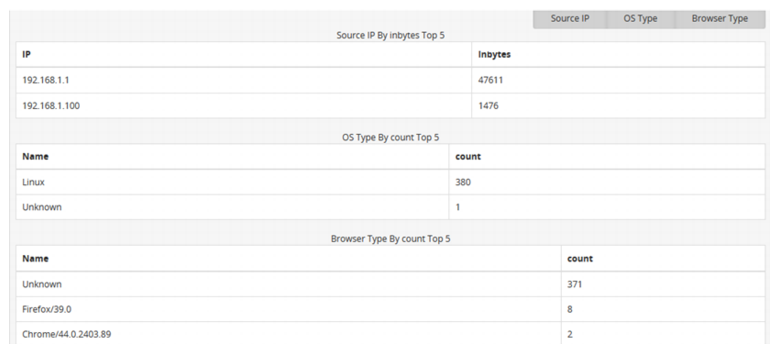
| Generate a report with the top client data. You can query by Source IP address, OS Type, or Browser Type. See Figure 66. Note: OS Type and Browser Type queries apply to HTTP servers only. |
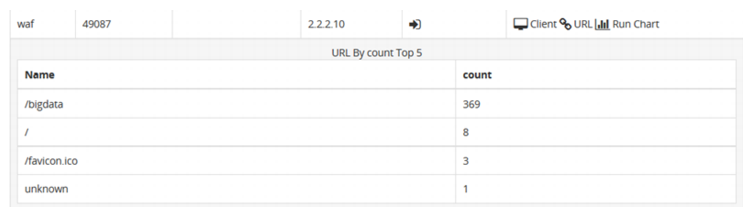
| Generate a report with the top destination URLs. See Figure 67. Note: Top URLs applies to HTTP servers only. |
| Drill into queries for the real servers or content routes that belong to this virtual server. See Figure 68. |