Testing your installation
When the configuration is complete, test it by forming connections between legitimate clients and servers at various points within your network topology.

|
In offline protection mode and transparent inspection mode, if your web server applies SSL and you need to support Google Chrome browsers, you must disable Diffie-Hellman key exchanges on the web server. These sessions cannot be inspected. |
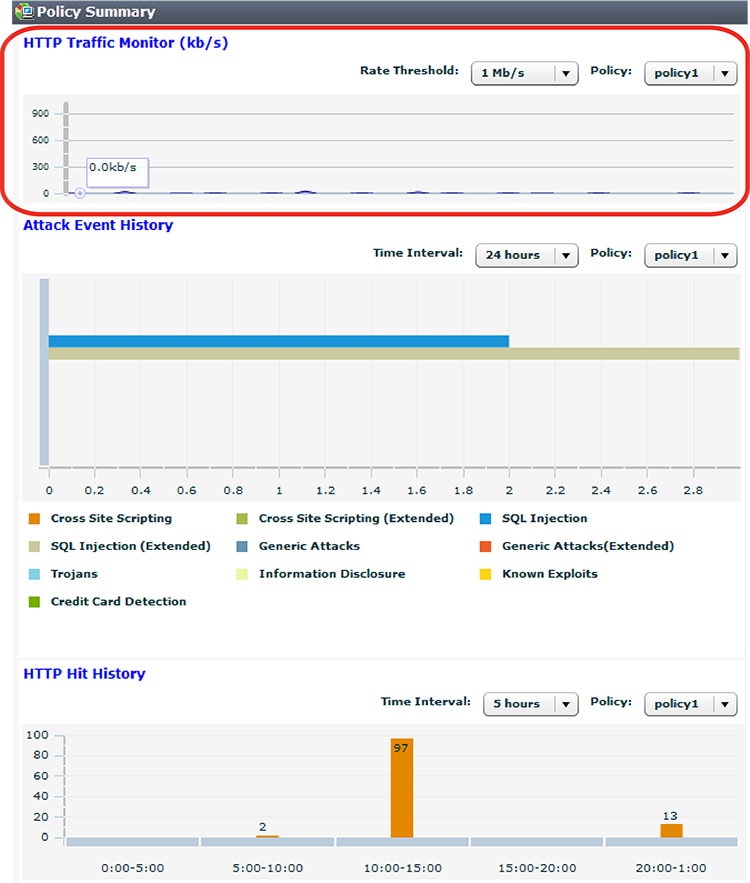
Examine the HTTP Traffic Monitor section of the Policy Summary widget on System > Status > Status. If there is no traffic, you have a problem. See Connectivity issues.
HTTP Traffic Monitor section of the Policy Summary widget
If a connection fails, you can use tools included in the firmware to determine whether the problem is local to the appliance or elsewhere on the network. See Troubleshooting. Also revisit troubleshooting recommendations included with each feature’s instructions.

|
If you have another FortiWeb appliance, you can use its web vulnerability scanner to verify that your policies are blocking attacks as you expect. For details, see Vulnerability scans. |
You may need to refine the configuration (see Expanding the initial configuration).
Once testing is complete, finish your basic setup with either Switching out of offline protection mode or Backups. Your FortiWeb appliance has many additional protection and maintenance features you can use. For details, see the other chapters in this guide.
Reducing false positives
If the dashboard indicates that you are getting dozens or hundreds of nearly identical attacks, they may actually be legitimate requests that were mistakenly identified as attacks (i.e. false positives). Many of the signatures, rules, and policies that make up protection profiles are based, at least in part, on regular expressions. If your web sites’ inputs and other values are hard for you to predict, the regular expression may match some values incorrectly. If the matches are not exact, many of your initial alerts may not be real attacks or violations. They will be false positives.
Fix false positives that appear in your attack logs so that you can focus on genuine attacks.
Here are some tips:
- Examine your web protection profile (go to Policy > Web Protection Profile and view the settings in the applicable offline or inline protection profile). Does it include a signature set that seems to be causing alerts for valid URLs. If so, disable the signature to reduce false positives.
- If your web protection profile includes a signature set where the Extended Signature Set option is set to Full, reduce it to Basic to see if that reduces false positives. See Specifying URLs allowed to initiate sessions.
- If your web protection profile includes HTTP protocol constraints that seem to be causing alerts for legitimate HTTP requests, create and use exceptions to reduce false positives. See Configuring HTTP protocol constraint exceptions.
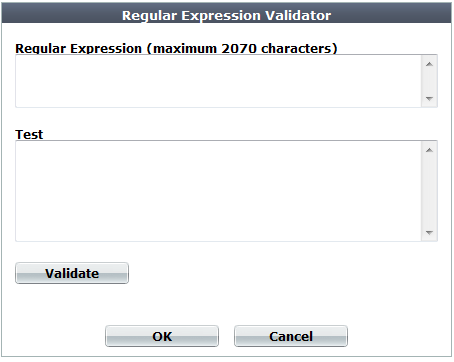
- Most dialog boxes that accept regular expressions include the >> (test) icon. This opens the Regular Expression Validator window, where you can fine-tune the expression to eliminate false positives.
- If you use features on the DoS Protection menu to guard against denial-of-service attacks, you could have false positives if you set the thresholds too low. Every client that accesses a web application generates many sessions as part of the normal process. Try adjusting some thresholds higher.
- To learn more about the behavior of regular expressions that generate alerts, enable the Retain Packet Payload options in the logging configuration. Packet payloads provide the actual data that triggered the alert, which may help you to fine tune your regular expressions to reduce false positives. See Enabling log types, packet payload retention, & resource shortage alerts and Viewing log messages.
Testing for vulnerabilities & exposure
Even if you are not a merchant, hospital, or other agency that is required by law to demonstrate compliance with basic security diligence to a regulatory body, you still may want to verify your security.
- Denial of service attacks can tarnish your reputation and jeopardize service income.
- Hacked servers can behave erratically, decreasing uptime.
- Malicious traffic can decrease performance.
- Compromised web servers can be used as a stepping stone for attacks on sensitive database servers.
To verify your configuration, start by running a vulnerability scan. See Vulnerability scans. You may also want to schedule a penetration test on a lab environment. Based upon results, you may decide to expand or harden your FortiWeb’s initial configuration (see Hardening security ).
Expanding the initial configuration
After your FortiWeb appliance has operated for several days without significant problems, it is a good time to adjust profiles and policies to provide additional protection and to improve performance.
- Begin monitoring the third-party cookies FortiWeb observes in traffic to your web servers. When cookies are found, an icon appears on Policy > Server Policy > Server Policy for each affected server. If cookies are threats, such as if they are used for state tracking or database input, consider enabling the Cookie Poisoning option on the inline protection profiles for those servers.
- Add any missing rules and policies to your protection profiles, such as:
Especially if you began in offline protection mode and later transitioned to another operation mode such as reverse proxy, new features may be available that were not supported in the previous operation mode.
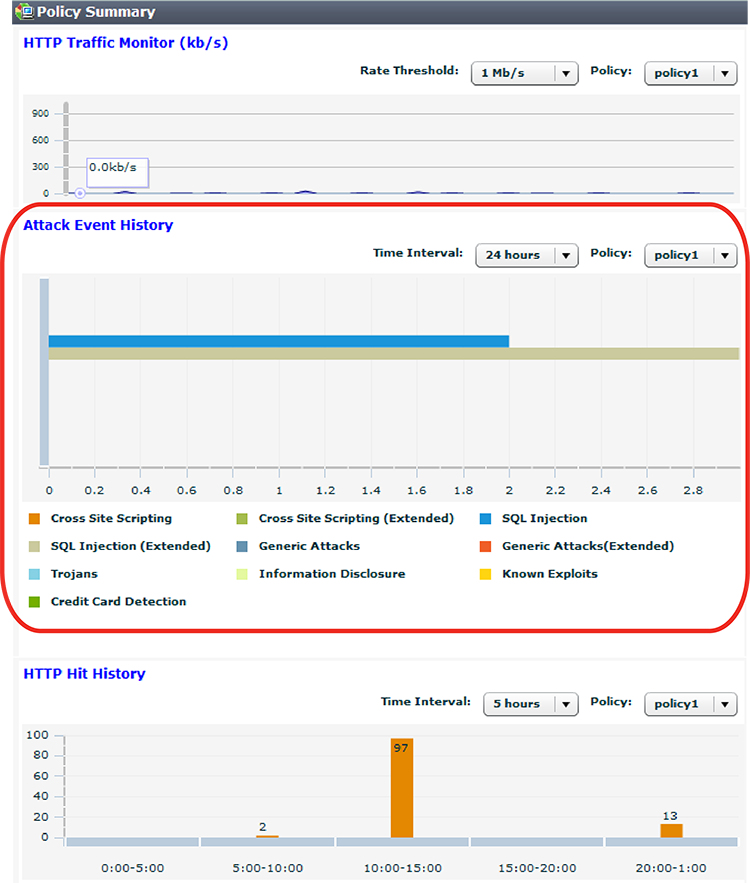
- Examine the Attack Event History in the Policy Summary widget on System > Status > Status. If you have zero attacks, but you have reasonable levels of traffic, it may mean the protection profile used by your server policy is incomplete and not detecting some attack attempts.
Attack Event History section of the Policy Summary widget
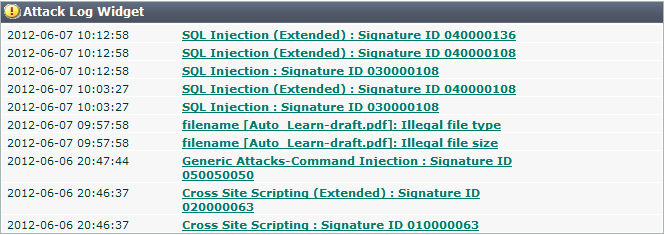
- Examine the Attack Log widget on System > Status > Status. If the list includes many identical entries, it likely indicates false positives. If there are many entries of a different nature, it likely indicates real attacks. If there are no attack log entries but the Attack Event History shows attacks, it likely means you have not correctly configured logging. See Configuring logging.
You can create reports to track trends that may deserve further attention. See Data analytics, Vulnerability scans, and Reports.
Open topic with navigation