How do I recover the password of the admin account?
What is the maximum number of ADOMs I can create?
How do I upload and validate a license for FortiWeb-VM?
How do I troubleshoot a high availability (HA) problem?
Why did the FortiGuard service update fail?
Why is URL rewriting not working?
How do I create a custom signature that erases response packet content?
How do I reduce false positives and false negatives?
Why is FortiWeb not forwarding non-HTTP traffic (for example, RDP, FTP) to back-end servers even though set ip-forward is enabled?
How do I prevent cross-site request forgery (CRSF or XSRF) with a custom rule?
Why is the Signature Violation filter I added to my Advanced Protection custom rule not working?
Why do I not see HTTP traffic in the logs?
Why do I see HTTP traffic in the logs but not HTTPS traffic?
How do I store traffic log messages on the appliance hard disk?
Why is the most recent log message not displayed in the Aggregated Attack log?
How can I sniff FortiWeb packets (packet capture)?
How do I trace packet flow in FortiWeb?
Why is the number of cookies reported in my attack log message different from the number of cookies that message detail displays?
How do I detect which cipher suite is used for HTTPS connections?
How do I use performance tests to determine maximum performance?
How can I measure the memory usage of individual processes?
If you forget the password of the admin administrator, you cannot recover it.
However, you can use the local console to reset the password. For detailed instructions, see Resetting passwords.
Alternatively, you can reset the FortiWeb appliance to its default state (including the default administrator account and password) by restoring the firmware. For instructions, see Restoring firmware (“clean install”).
The maximum number of Administrative domains (ADOMs) you can define depends on the appliance model and, in the case of virtual appliances, the amount of vRAM allocated to FortiWeb.
| FortiWeb 400B/1000B | FortiWeb-VM (2-4 GB RAM) | FortiWeb-VM (4-8 GB RAM) | FortiWeb-VM (8-16 GB RAM), FortiWeb 400C, FortiWeb 1000C, FortiWeb 3000C/CFsx, FortiWeb 4000C |
FortiWeb-VM 16+ GB RAM,FortiWeb 1000D, FortiWeb 3000D/DFsx, FortiWeb 4000D |
|---|---|---|---|---|
| N/A | 4 | 12 | 32 | 64 |
For additional information on maximum values (for example, the number of policies per appliance), see Appendix B: Maximum configuration values.
FortiWeb-VM includes a free 15-day trial license that includes all features except:
Once the trial expires, most functionality is disabled. You need to purchase a license to continue using FortiWeb-VM.
When you purchase a license for FortiWeb-VM, Fortinet Technical Support (https://support.fortinet.com) provides a license file that you can use to convert the trial license to a permanent, paid license.
You can upload the license via the web UI. The uploading process does not interrupt traffic or trigger an appliance reboot.
For detailed instructions for accessing the web UI and uploading the license, see the FortiWeb-VM Install Guide.
1. Go to the FortiWeb-VM web UI.
For hypervisor deployments, the URL is the IP address of port1 of the virtual appliance, such as:
For FortiWeb-VM deployed on AWS, the URL is the public DNS address displayed in the instance information for the appliance in your AWS console.
2. Log in to the web UI as the admin user.
For hypervisor deployments, by default, the admin user does not use a password.
For AWS deployments, by default, the password is the AWS instance ID.
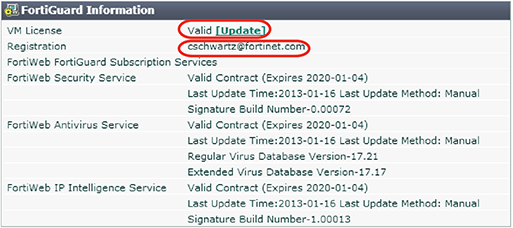
3. Go to System > Status > Status. The FortiGuard Information widget contains the link you use to upload a license file.
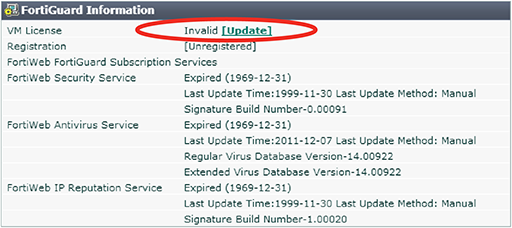
4. Click Update.
5. Browse to the license file (.lic) you downloaded earlier from Fortinet, then click OK.
FortiWeb connects to Fortinet to validate its license. In most cases, the process is complete within a few seconds. A message appears:
License has been uploaded. Please wait for authentication with registration servers.
6. In the message box, click Refresh.
If you uploaded a valid license, the following message is displayed:
License has been successfully authenticated with registration servers.
The web UI logs you out. The login dialog reappears.
7. Log in again.
8. To verify that the license was uploaded successfully, log in to the web UI again, then view the FortiGuard Information widget. The VM License row should say Valid.
Also view the System Information widget. The Serial Number row should have a number that indicates the maximum number of vCPUs that can be allocated according to the FortiWeb-VM software license, such as FVVM020000003619 (where “VM02” indicates a limit of 2 vCPUs).
FortiGuard Information widget on System > Status > Status in the web UI after license validation
If a high availability (HA) cluster is not behaving as expected, use the following troubleshooting steps to help find the source of the problem:
1. Ensure the physical connections are correct:
2. Ensure the following HA configuration is correct:
3. Use the following commands to collect information about the HA cluster:
| Command | Purpose |
|---|---|
|
|
Displays information about current HA cluster members, including:
Helps confirm if the 2 appliances are part of the same cluster and which one is the master. |
execute ha md5sum
|
Retrieves the CLI system configuration MD5 from the 2 appliances in a HA cluster. Helps confirm whether HA configuration is synchronized. |
execute ha disconnect
|
Run on master appliance to disconnect slave without disconnecting cables. You can then connect to the slave as if it were a standalone appliance for troubleshooting purposes. |
execute ha manage
|
If the Override option is selected, you can run this command on the master appliance to assign a higher priority to the slave appliance, which manually triggers a HA failover. You specify the serial number of the slave appliance and the new priority. For example: execute ha manage FV-1KC3R11111111 1 |
|
|
Manually triggers configuration synchronization:
Also refreshes the md5sum value, which you use to confirm synchronization status. |
|
|
Manually triggers synchronization of a database file:
You can only trigger this type of synchronization manually. |
|
|
Use to stop or start synchronization during debugging. |
diagnose debug application hasync 1
|
Configures the debug logs for HA synchronization to display messages about the automatic configuration synchronization process, commands that failed, and the full configuration synchronization process. Run on both members of the HA cluster to confirm configuration synchronization and communication between the appliances. Alternatively, use the following command to configure HA synchronization debug logs to display all messages: diagnose debug application hasync -1 Before you run this command, run the following commands to turn on debug log output and enable timestamps: diagnose debug enable diagnose debug console timestamp enable |
diagnose debug application hatalk 1
|
Configures the debug logs for HA heartbeat links to display messages about the heartbeat signal, HA failover, and the uptime of the members of the HA cluster. Alternatively, use the following command to configure HA heartbeat debug logs to display all messages: diagnose debug application hatalk -1 Before you run this command, run the following commands to turn on debug log output and enable timestamps: diagnose debug enable diagnose debug console timestamp enable |
4. If your HA cluster is deployed in a custom environment, following commands provide useful information for troubleshooting (run on both members of the cluster):
get system status
diagnose debug application hatalk 1
diagnose debug application hasync 1
execute ha sync waf
execute ha md5sum
For detailed information about these commands, see the FortiWeb CLI Reference.
For detailed information about HA topology and configuration, see HA heartbeat & synchronization and Configuring a high availability (HA) FortiWeb cluster.
1. To enable the file uploading and downloading functionality, use the CLI to enter the following commands:
config system settings
set enable-file-upload enable
end
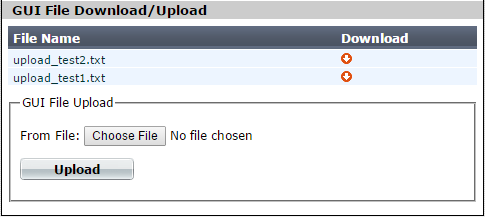
2. In the web UI, go to System > Maintenance > Backup & Restore.
At the bottom of the page, under GUI File Download/Upload, click Choose File to navigate to a file and select it, and then click Upload to copy it to FortiWeb.
When the upload is complete, the file is displayed in the File Name list.
3. To maintain security, use the following CLI commands to disable the file uploading functionality:
config system settings
set enable-file-upload disable
end
1. To enable the file uploading and downloading functionality, use the CLI to enter the following commands:
config system settings
set enable-file-upload enable
end
2. In the web UI, go to System > Maintenance > Backup & Restore.
3. At the bottom of the page, under GUI File Download/Upload, click the download icon for the file you want to download.
4. To maintain security, use the following CLI commands to disable the file uploading functionality:
config system settings
set enable-file-upload disable
end
If your automatic FortiGuard service update is not successful, complete the following troubleshooting steps:
1. Ensure that your firewall rules allow FortiWeb to access the Internet via TCP port 443.
This is the port that FortiWeb uses to poll for and download FortiGuard service updates from the FortiGuard Distribution Network (FDN).
2. Ensure FortiWeb can communicate with the DNS server.
When it performs the initial FortiGuard service update, FortiWeb requires access to the DNS server to resolve the domain name fds.fortinet.com to the appropriate host name.
3. Because the size of the virus signature database exceeds 200MB, an unstable network can interrupt the TCP session that downloads the database. If the download fails for this reason, obtain the latest version of the virus signature database from support.fortinet.com and perform the update manually. See Uploading signature & geography-to-IP updates.
FortiWeb resumes automatic updates of the database at the next scheduled time.
4. If the previous steps do not solve the problem, use the following commands to obtain additional information:
diagnose debug enable
diagnose debug application fds 7
If you need to contact Fortinet Technical Support for assistance, provide the output of these diagnose debug commands and a configuration file.
For more information about these commands, see the FortiWeb CLI Reference.
For additional methods for verifying FortiGuard connectivity, see Connecting to FortiGuard services.
If FortiWeb is not rewriting URLs as expected, complete the following troubleshooting steps:
1. Ensure the value of Action Type is correct.
Request Action rewrites HTTP requests from clients, and Response Action rewrites responses to clients from the web server.
2. Ensure that you have added items to the URL Rewriting Condition Table.
3. If one of your conditions uses a regular expression, ensure that the expression is valid. Click the >> (double arrow) button beside the Regular Expression field to test the value.
For an online guide for regular expressions, go to:
http://www.regular-expressions.info/reference.html/
For an online library of regular expressions, go to:
4. If the page is compressed, ensure that you have configured a decompression policy.
For more information, see Configuring temporary decompression for scanning & rewriting.
5. Go to System > Config > Advanced and adjust the value of Maximum Body Cache.
URL body rewriting does not work when the page is larger than the cache buffer size. The default size is 64KB.
To adjust the buffer using the CLI, use a command like the following example:
config global
config sys advanced
set max-cache-size 1024
end
end
6. Ensure that FortiWeb supports the page’s Content-Type, which specifies its MIME type. FortiWeb supports the following Content-Type values only:
1. Create a custom signature rule that includes the following values:
| Direction | Response |
| Expression | Either a simple string or a regular expression that matches the response to erase. |
| Action |
Alert & Erase The erase action replaces the content specified by Expression with |
2. Add an appropriate target:
RESPONSE_BODY
If the page is compressed, ensure that you have configured a decompression policy. Otherwise, the erase action does not work.
For more information, see Configuring temporary decompression for scanning & rewriting.
RESPONSE_STATUS
The RESPONSE_STATUS is not erased in the raw packet.
If the target is RESPONSE_HEADER or RESPONSE_STATUS, the body of the response is still displayed.
3. Add the rule to a custom signature group, and then add the group to a signature policy that you can add to an inline or offline protection profile.
For detailed custom signature creation instructions, see Defining custom data leak & attack signatures.
If FortiWeb is identifying legitimate requests as attacks (false positives), complete the following troubleshooting steps:
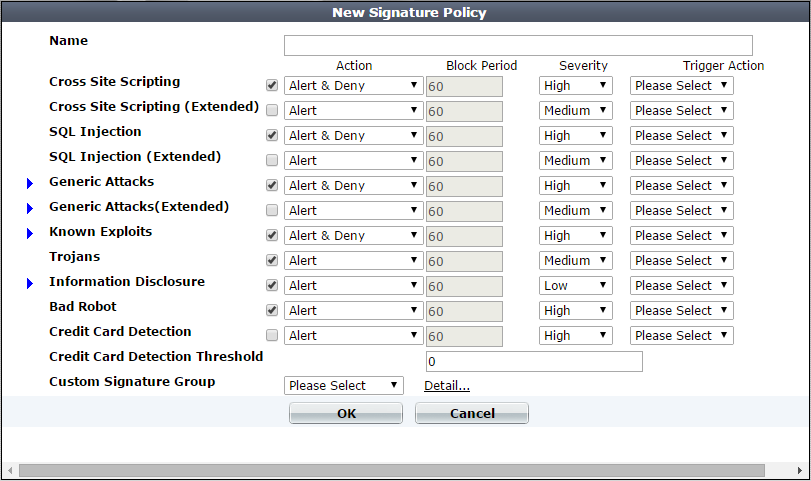
1. If your web protection profile uses a signature policy in which the extended version of a signature set is enabled (for example, Cross Site Scripting (Extended)), disable it.
The extended signature sets detect a wider range of attacks but are also more likely to generate false positives.
For detailed information, see Blocking known attacks & data leaks.
2. Specify the appropriate URL as an exception in the signature configuration. To create this exception, click either the Exception link in the Message field of the attack log item or Advanced Mode in the Edit Signature Policy dialog box.
For detailed instructions, see Configuring action overrides or exceptions to data leak & attack detection signatures.
3. If the configuration changes do not solve the problem, capture the packet that FortiWeb has incorrectly identified as an attack and contact Fortinet Technical Support for assistance.
Fortinet can resolve the issue by modifying the attack signature.
If FortiWeb is identifying attacks as legitimate requests (false negatives), complete the following troubleshooting steps:
1. Use the Advanced Mode option to ensure that the signature policy that your web protection profile uses has the following configuration:
2. If your signature configuration is correct, capture the packet that FortiWeb did not identify as an attack and contact Fortinet Technical Support for assistance.
Fortinet can resolve the issue by adding an attack signature. In the meantime, you can resolve the problem by creating a custom signature. For detailed instructions, see Defining custom data leak & attack signatures.
For additional information about reducing false positives, see Reducing false positives.
The config router setting command allows you to change how FortiWeb handles non-HTTP/HTTPS traffic when it is operating in reverse proxy mode.
When the setting ip-forward is enabled, for any non-HTTP/HTTPS traffic with a destination other than a FortiWeb virtual server (for example, a back-end server), FortiWeb acts as a router and forwards it based in its destination address.
However, any non-HTTP/HTTPS traffic destined for a virtual server on the appliance is dropped.
Therefore, if you require clients need to reach a back-end server using FTP or another non-HTTP/HTTPS protocol, ensure the client uses the back-end server's IP address.
For more detailed information about this setting and a configuration that avoids this problem, see the “Router setting” topic in the FortiWeb CLI Reference.
A cross-site request forgery attack takes advantage of the trust that a site has in a client’s browser to execute unwanted actions on a web application. For example, to test your web site’s vulnerability to one CRSF method, Cross-Frame Scripting (XFS), go to the following location:
http://sec101.sourceforge.net/cross_site_framing.php
1. Go to Web Protection > Advanced Protection > Custom Rule.
2. Click Create New.
3. Configure the action and trigger settings for the rule.
For detailed information on these settings, see Combination access control & rate limiting.
4. Click Create New to add a rule entry.
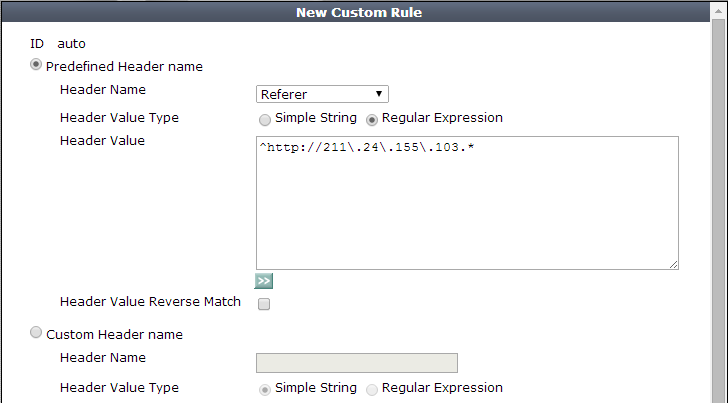
5. For Filter Type, select HTTP Header, and then click OK.
6. Configure these settings:
| Setting name | Value |
|---|---|
| Header Name | Referer |
| Header Value Type | Regular Expression |
| Header Value |
A regular expression that matches the address of your web site. For example, if your web site is http://211.24.155.103/, use the following expression: ^http://211\.24\.155\.103.* |
7. Click OK to save the rule entry, and then click OK to save the rule.
8. Go to Web Protection > Advanced Protection > Custom Policy to group the custom rule into a policy.
For detailed information on creating policies, see Combination access control & rate limiting.
9. To apply the policy, select it as the Custom Rule in a protection profile (see Configuring a protection profile for inline topologies or Configuring a protection profile for an out-of-band topology or asynchronous mode of operation).
Attack log messages contain Custom Access Violation when this feature detects an unauthorized access attempt.
To add a Signature Violation filter to an Advanced Protection custom rule, you select Signature Violation as the filter type.
However, for the filter to work, the following configuration steps are also required:
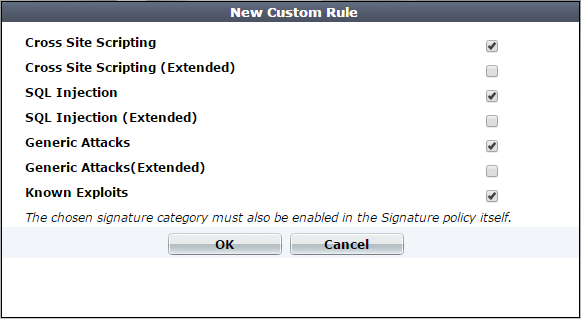
You select the custom policy that contains the rule and corresponding signature set when you create a protection profile.
For more information, see Combination access control & rate limiting and Blocking known attacks & data leaks.
Successful HTTP traffic logging depends on both FortiWeb configuration and the configuration of other network devices. If you do not see HTTP traffic in the traffic log, ensure that the configuration described in the following tables is correct.
| Configuration | What to look for | See |
|---|---|---|
| Logging |
Ensure logging is enabled and configured. By default, logging is not enabled. |
Configuring logging |
| Servers | Ensure that the IP address of your physical server and the IP address of your virtual server are correct. | |
| Server policy | Ensure that the server policy associates the appropriate virtual server with the correct physical servers (as members of a server pool). | Configuring a server policy |
| Network interfaces |
Go to System > Network > Interface and ensure the ports for inbound and outbound traffic are up. Use sniffing (packet capture) to ensure that you can see traffic on both inbound and outbound network interfaces. Ensure that the network interfaces are configured with the correct IP addresses. In a typical configuration, port1 is configured for management (web UI access) and the remaining ports associated with the required subnets. |
Configuring the network interfaces How can I sniff FortiWeb packets (packet capture)? (overview) or Packet capture |
| VLANs (if used) | Make sure that the VLAN is associated with the correct physical port (Interface setting). | Adding VLAN subinterfaces |
| Firewalls & routers | Communications between the FortiWeb appliance, clients, protected web servers, and FortiGuard Distribution Network (FDN) require that any routers and firewalls between them permit specific protocols and port numbers. | Appendix A: Port numbers |
| Load balancers | If the load balancer is in front of FortiWeb, the physical IP addresses on it are the FortiWeb virtual IP addresses. If the Load Balancer is behind the FortiWeb, the FortiWeb physical server is the virtual IP for the load balancer's virtual IP. | External load balancers: before or after? |
| Web server | Ensure that the web server is up and running by testing it without FortiWeb on the network. | Checking routing |
| Configuration | What to look for | See |
|---|---|---|
| Logging |
Ensure logging is enabled and configured. By default, logging is not enabled. |
Configuring logging |
| Server/server pool | Ensure that the configuration for the physical server in the server pool contains the correct IP address. | |
| Server policy | Ensure that the server policy associates the appropriate virtual server with the correct physical servers (as a member of a server pool). | Configuring a server policy |
| Bridge (v-zone) |
Ensure the v-zone is configured using the correct FortiWeb ports. In the list of network interfaces (Global > System > Network > Interface), the Status column identifies interfaces that are members of a v-zone. To ensure that the bridge is forwarding traffic, in the list of v-zones, under Interface, look for the status “forwarding” following the names of the ports. |
Configuring a bridge (V-zone) |
| VLANs (if used) | Make sure that the VLAN is associated with the correct physical port (Interface setting). | Adding VLAN subinterfaces |
| Firewalls & routers | Communications between the FortiWeb appliance, clients, protected web servers, and FortiGuard Distribution Network (FDN) require that any routers and firewalls between them permit specific protocols and port numbers. | Appendix A: Port numbers |
| Web server | Ensure that the web server is up and running by testing it without FortiWeb on the network. | Checking routing |
| Configuration | What to look for | See |
|---|---|---|
| Logging |
Ensure logging is enabled and configured. By default, logging is not enabled. |
Configuring logging |
| Server/server pool | Ensure that the configuration for the physical server in the server pool contains the correct IP address. | |
| Server policy | Ensure that the server policy associates the appropriate virtual server with the correct physical servers (as members of a server pool). | Configuring a server policy |
| Bridge (v-zone) |
Ensure the v-zone is configured using the correct FortiWeb ports. In the list of network interfaces (Global > System > Network > Interface), the Status column identifies interfaces that are members of a v-zone. To ensure that the bridge is forwarding traffic, in the list of v-zones, under Interface, look for the status “forwarding” following the names of the ports. |
Configuring a bridge (V-zone) |
| VLANs (if used) | Make sure that the VLAN is associated with the correct physical port (Interface setting). | Adding VLAN subinterfaces |
| Network interfaces | Use sniffing (packet capture) to ensure that you can see traffic on both inbound and outbound network interfaces. |
Configuring the network interfaces How can I sniff FortiWeb packets (packet capture)? (overview) or Packet capture |
| Web server | Ensure that the web server is up and running by testing it without FortiWeb on the network. | Checking routing |
Use the following steps to troubleshoot HTTPS traffic logging:
1. Ensure FortiWeb has the certificates it needs to offload or inspect HTTPS.
See How to offload or inspect HTTPS.
2. Use sniffing (packet capture) to look for errors in HTTPS traffic.
See How can I sniff FortiWeb packets (packet capture)? (overview) or Packet capture.
You can configure FortiWeb to store traffic log messages on its hard disk.
In most environments, and especially environments with high traffic volume, enabling this option for long periods of time can cause the hard disk to fail prematurely. Do not enable it unless it is necessary and disable it as soon as you no longer need it.
For information on configuring logging to the hard disk using the web UI, see Configuring logging.
To enable logging to the hard disk via the CLI, log in using an account with either w or rw permission to the loggrp area and enter the following commands:
config log traffic-log
set disk-log enable
Use the following commands to verify the new configuration:
get log traffic-log
A response that is similar to the following message is displayed:
status : enable
packet-log : enable
disk-log : enable
Alternatively, use the following command to display a sampling of traffic log messages:
diagnose log tlog show
A response that is similar to the following message is displayed:
Total time span is 39.252285 seconds
Time spent on waiting is 13.454448 seconds
Time spent on preprocessing is 3.563218 seconds
traffic log processed: 69664
where:
Total time span is the total amount of time of the logd process handle logs (that is, receiving messages from other process, filtering messages, outputting in standard format, writing the logs to the local database, and so on)Time spent on waiting is the amount of time of the logd process waited to receive messages from other processesTime spent on preprocessing is the amount of time the logd process spent filtering and format i ng messagestraffic log processed is the total number of logs that the logd process handled in this cycleFor more information about the config log traffic-log and diagnose log tlog show commands, see the FortiWeb CLI Reference.
If recent log messages do not appear in the Aggregated Attack log as expected, complete the following troubleshooting steps:
1. Use the dashboard to see if the appliance is busy.
When FortiWeb generates an attack log, the appliance writes it to and reads it from the hard disk and then updates the logging database.
The process that retrieves Aggregated Attack log information from the database (indexd) has a lower priority than the processes that analyze and direct traffic. Therefore, increased demand for FortiWeb processing resources (for example, when traffic levels increase) can delay updates to the log.
2. Rebuild the logging database.
Events such as a power outage can corrupt the logging database. Use the following command to rebuild it:
exec db rebuild
This command deletes and rebuilds the database. It does not delete any logs on the hard disk and no log information is lost.
Use the diagnose network sniffer command to perform a packet trace on one or more interfaces.
For example, the following command captures TCP port 80 traffic arriving at or departing from 192.168.1.1, for all network interfaces. The value 3 specifies the verbosity level (3 captures the most detail):
diagnose network sniffer any 'tcp and port 80 and host 192.168.1.1' 3
For detailed information and instructions on using this command and its output, see Packet capture.
The following steps are an overview of the process:
1. Using a terminal emulator such as SecureCRT or Putty, connect to the appliance via SSH or Telnet, run the sniffer command, and save the output to a file (for example, detail_output.log).
A terminal emulator is required because the console is too slow for this task and cannot display all of the output.
2. Install a Perl interpreter and Wireshark (or equivalent application) on your PC.
3. To convert the packet capture command to a format that Wireshark can use, run the following command:
perl ./fgt2eth.pl -in detail_ouput.log -out converted.cap
(You can run the Perl script in Windows or Linux.)
To download fgt2eth.pl, see the Fortinet Knowledge Base article Using the FortiOS built-in packet sniffer.
|
|
The fgt2eth.pl script is provided as-is, without any implied warranty or technical support. |
Use the following steps to use the console to view packet flow information for a specified client IP when it accesses a virtual server IP:
1. Using the CLI, use the following command to turn on debug log output:
diagnose debug enable
2. Use a command similar to the following to limit the debug logs to those that match a specific client IP address:
diagnose debug flow filter client-ip 172.22.6.232
3. Use the following command to include details from each module that processes the packet:
diagnose debug flow filter module-detail on
4. Use the following command to start the flow trace:
diagnose debug flow trace start
The following output is an example of the results of these commands:
Module name:WAF_X_FORWARD_FOR_PROCESS, Execution:4, Process error:0, Action:ACCEPT
Module name:WAF_IP_INTELLIGENCE, Execution:3, Process error:6, Action:ACCEPT
Module name:WAF_KNOWN_ENGINES, Execution:4, Process error:0, Action:ACCEPT
Module name:HSTS_HEADER_PROCESS, Execution:4, Process error:5, Action:ACCEPT
Module name:WAF_HTTP_ACTIVE_SCRIPT, Execution:3, Process error:2, Action:ACCEPT
Module name:WAF_SESSION_MANAGEMENT, Execution:4, Process error:0, Action:ACCEPT
Module name:WAF_HTTP_DOS_HTTP_FLOOD, Execution:4, Process error:0, Action:ACCEPT
Module name:WAF_HTTP_DOS_MALICIOUS_IP, Execution:4, Process error:8, Action:ACCEPT
Module name:HTTP_ACCLIMIT_LIMIT, Execution:4, Process error:-1, Action:ACCEPT
Module name:WAF_GLOBAL_WHITE_LIST, Execution:4, Process error:-1, Action:ACCEPT
Module name:WAF_GLOBAL_WHITE_LIST, Execution:4, Process error:-1, Action:ACCEPT
Module name:WAF_URL_ACCESS_POLICY, Execution:4, Process error:8, Action:ACCEPT
Module name:HTTP_CONSTRAINTS, Execution:4, Process error:2, Action:ACCEPT
Module name:WAF_COOKIE_POISON, Execution:4, Process error:0, Action:ACCEPT
Module name:WAF_START_PAGES, Execution:4, Process error:-1, Action:DENY
Module name:WAF_CUSTOM_ACCESS_POLICY, Execution:4, Process error:6, Action:ACCEPT
Module name:WAF_HTTP_STATISTIC, Execution:4, Process error:0, Action:ACCEPT
For additional information on these commands (for example, to specify debug logs for a specific flow direction), see the FortiWeb CLI Reference.
When FortiWeb generates an attack log message because a request exceeds the maximum number of cookies it permits, the message value includes the number of cookies found in the request. In addition, the message details include the actual cookie values.
For performance reasons, FortiWeb limits the size of the attack log message. If the amount of cookie value information exceeds the limit for cookies in the attack log, the appliance displays only some of the cookies the message detail.
Use sniffing (packet capture) to capture SSL/ TLS traffic and view the “Server hello” message, which includes cipher suite information.
For more HTTPS troubleshooting information, see Supported cipher suites & protocol versions and Checking the SSL/TLS handshake & encryption.
Use performance tests and the dashboard's System Resources widget to determine where the appliance reaches its maximum capacity (bottleneck).
| Type of test | Maximum performance indicator |
|---|---|
| Requests per second (RPS), connections per second (CPS) | Rate of requests or connections maintains CPU Usage at 100% |
| Concurrent connections | Number of connections maintains Memory Usage at 90% |
| Throughput test | Throughput maintains the value of CPU Usage at 100%. (A pair of gigabit ports provide bandwidth of up to 2 Gbps.) |
If your CPU and memory values do not reach the specified values, adjust your client and server test configuration until you can determine maximum performance.
The diagnose policy command allows you to view the memory usage associated with all server policies or a specific policy. For example:
diagnose policy memory all
The diagnose hardware mem command allows you to display the usage statistics of ephemeral memory (RAM), including swap pages and shared memory (Shmem). For example, to display total memory usage:
diagnose hardware mem list
For additional information on these commands, see the FortiWeb CLI Reference.