Web-based manager session information
In the web-based manager there are actually two places to view session information — the policy session monitor, and the dashboard Top Sources, Top Destinations and Top Applications
Top Sessions Dashboard
Top Sources Dashboard shows Top Sessions by source Address, Top Destinations shows Top sessions by Destination address, and Top Applications shows Top Sessions by applications. If there are not enough entries in the session table, try browsing to a different web site and re-examine the table. The Policy ID shows which security policy matches the session. The sessions that do not have a Policy ID entry originate from the FortiGate device
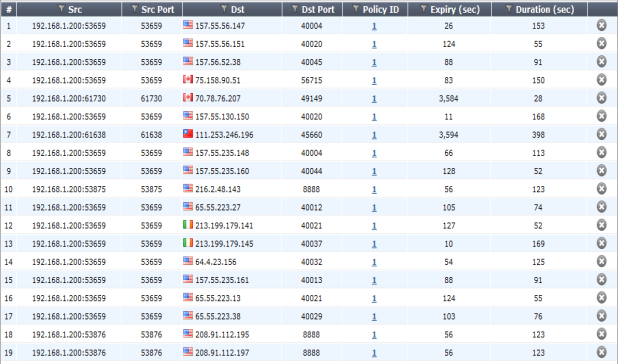
Session monitor
The session monitor is the session table. It lists the protocol used, source and destination addresses, source and destination ports, what policy ID was matched (if any), how long until the session expires, and how long it has been established.
If there is no policy ID listed in the session entry, the traffic originated from the FortiGate unit. Otherwise all sessions must match a security policy to pass through the FortiGate unit. You can specify a filter to show Forward Traffic only. To do this, click on the Edit icon (it looks like a pencil)
As there are potentially many sessions active at one time, there are different methods you can use to filter unimportant sessions out of your search. The easiest filter is to display only IPv4 or IPv6 sessions. By default both are displayed.