Example weighted load balancing configuration
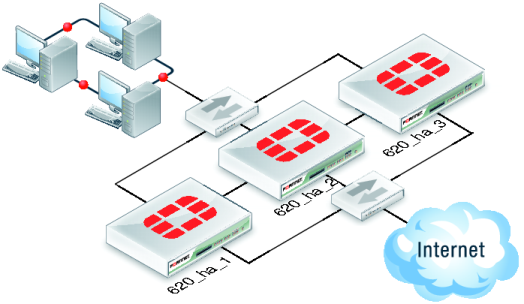
Consider a cluster of three FortiGate-620B units with host names 620_ha_1, 620_ha_2, and 620_ha_3 as shown in
Figure 215. This example describes how to configure weighted load balancing settings for CPU and memory usage for the cluster and then to configure UTM proxy weights to send most HTTP and POP3 proxy sessions to different cluster units.
Connect to the cluster CLI and use the following command to set the CPU usage threshold weight to 30, low watermark to 60, and high watermark to 80. This command also sets the memory usage threshold weight to 10, low watermark to 60, and high watermark to 90.
config system ha
set mode a-a
set schedule weight-round-robin
set cpu-threshold 30 60 80
set memory-threshold 10 60 90
end
The static weights for the cluster units remain at the default values of 40. Since this command changes the mode to a-a and the schedule to weight-round-robin for the first time, the weight settings are synchronized to all cluster units.
As a result of this configuration, if the CPU usage of any cluster unit (for example, 620_ha_1) reaches 80% the static weight for that cluster unit is reduced from 40 to 10 and only 10 of every 120 new sessions are load balanced to this cluster unit. If the memory usage of 620_ha_1 also reaches 90% the static weight further reduces to 0 and no new sessions are load balanced to 620_ha_1. Also, if the memory usage of 620_ha_2 reaches 90% the static weight of 620_ha_2 reduces to 30 and 30 of every 120 new sessions are load balanced to 620_ha_2.
Now that you have established the weight load balancing configuration for the entire cluster you can monitor the cluster to verify that processing gets distributed evenly to all cluster units. From the web‑based manager you can go do System > Config > HA > View HA Statistics and see the CPU usage, active sessions, memory usage and other statistics for all of the cluster units. If you notice that one cluster unit is more or less busy than others you can adjust the dynamic weights separately for each cluster unit.
For example, in some active-active clusters the primary unit may tend to be busier than other cluster units because in addition to processing sessions the primary unit also receives all packets sent to the cluster and performs load balancing to distribute the sessions to other cluster units. To reduce the load on the primary unit you could reduce the CPU and memory usage high watermark thresholds for the primary unit so that fewer sessions are distributed to the primary unit. You could also reduce the primary unit’s high watermark setting for the proxies to distribute more proxy sessions to other cluster units.
If the example cluster is configured for 620_ha_2 to be the primary unit, connect to the 620_ha_2’s CLI and enter the following command to set CPU usage, memory usage, and proxy usage high watermark thresholds lower.
config system ha
set cpu-threshold 30 60 70
set memory-threshold 30 60 70
set http-proxy-threshold 30 60 70
set ftp-proxy-threshold 30 60 70
set imap-proxy-threshold 30 60 70
set nntp-proxy-threshold 30 60 70
set pop3-proxy-threshold 30 60 70
set smtp-proxy-threshold 30 60 70
end
As a result, when any of these factors reaches 70% on the primary unit, fewer sessions will be processed by the primary unit, preventing the number of sessions being processed from rising.