Figure 169: Add Monitor window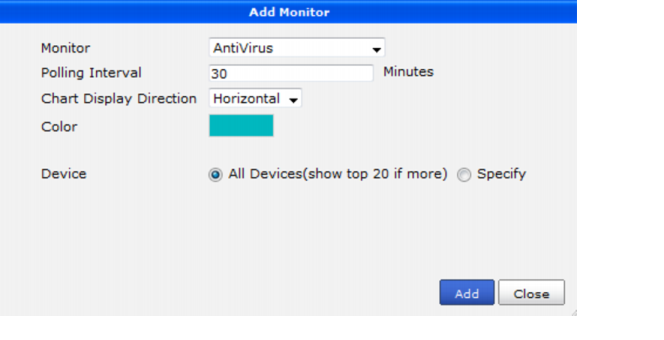
Monitor | Select the variable to monitor. | |
Polling Interval | Enter the frequency with which to request information from the monitored device. Polling more often generates more data but slows down the device a bit. The polling interval cannot be less than 5 minutes. | |
Chart Display Direction | Select Horizontal or Vertical from the drop-down list. | |
Color | Select the color for the chart. | |
Device | Select All Devices, or Specify to select individual devices. | |