Figure 273: Charts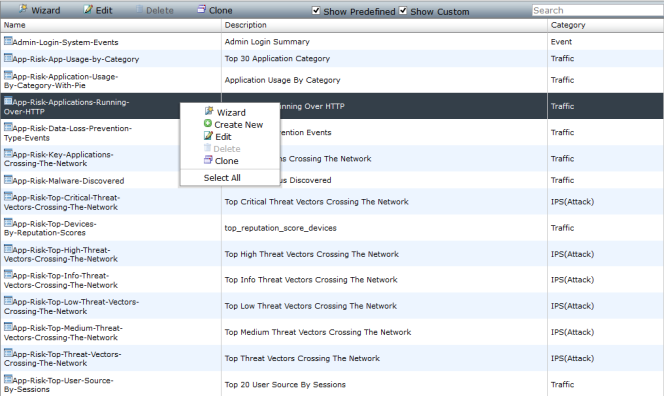 page
page
page pageWizard | Select to launch the chart builder wizard. |
Edit | Select to edit a chart. |
Delete | Select to delete a chart. |
Clone | Select to clone an existing chart. |
Show Predefined | Select to display predefined charts. |
Show Custom | Select to display custom charts. |
Search | Use the search field to find a specific chart. |
Create New | Select Create New from the right-click menu to use the advanced chart builder. |
The available predefined charts may change. FortiManager v5.0 Patch Release 3 or later include enhanced charts for FortiGate and charts for FortiMail and FortiWeb. |
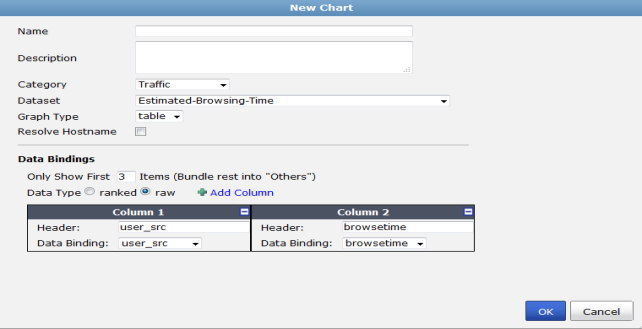
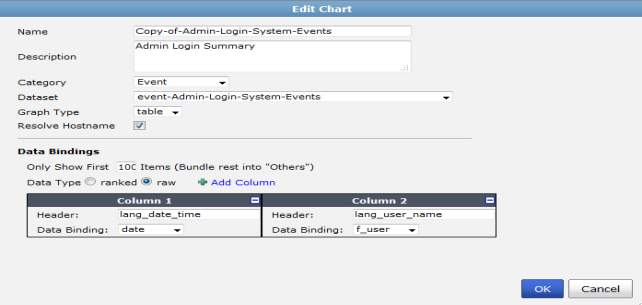
Name | Enter a name for the chart. | ||
Description | Enter a description. | ||
Category | Select a category for the chart from the drop-down menu. Select one of the following: Traffic, Event, FortiMail, IPS(Attack), Web Filter, Virus, Network Scan, Email Filter, FortiWeb, or WiFi. | ||
Dataset | Select a dataset from the drop-down list. See “Dataset” for more information. These filters will vary based on device type. | ||
Graph Type | Select a graph type from the drop-down list. Select one of the following: bar, pie, table, or line. | ||
Resolve Hostname | Select to resolve the hostname. | ||
bar, pie, or line | |||
Line Subtype | Select one of the following: basic, stacked, or back-to-back. This option is only available when line is selected as the graph type. | ||
X-Axis | Data Binding: Select a value from the drop-down menu. Only Show First: Enter a numerical value. Only the first ‘X’ items will be displayed. Other items are bundled into Others. Overwrite label: Enter a label. | ||
Y-Axis | Order By: Select a value from the drop-down menu. Data Binding: Select a value from the drop-down menu. Overwrite label: Enter a label. | ||
Order By | Select to order by the X-Axis or Y-Axis. This option is only available when the graph type is line or bar. | ||
table | |||
Only Show First Items | Enter a numerical value. Only the first ‘X’ items will be displayed. Other items are bundled into Others. | ||
Data Type | Select either ranked or raw. | ||
Columns | Up to fifteen columns can be included. Header: Enter header information. Data Binding: Select a value from the drop-down menu. | ||
Add Column | Select to add a column. | ||
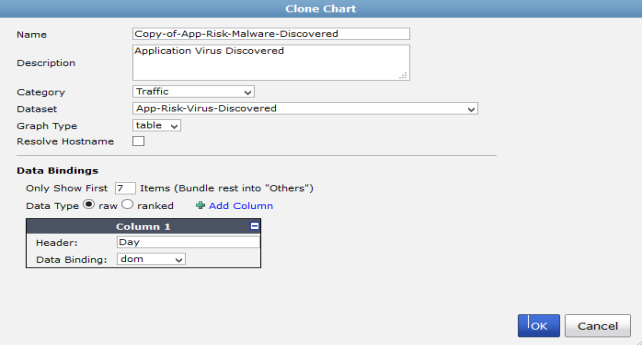
Predefined charts cannot be edited, the information is read-only. You can clone a predefined chart and make changed to the copy. |
Predefined charts cannot be deleted, the information can only be viewed. |