Figure 272: Preview page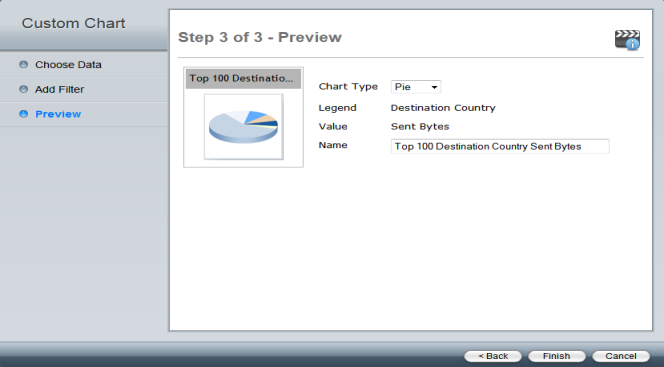
Chart Type | Select the chart type in the drop-down list. Select one of the following: Table, Bar, Line, or Pie. Note: Depending on the chart settings, you may not be able to change the chart type. |
Column 1/Y-axis | Displays the Group by selection. |
Column 2/X-axis | Displays the Aggregate by selection. |
Name | Displays the default name of the custom chart. You can edit the name field. |