Figure 270: Choose data page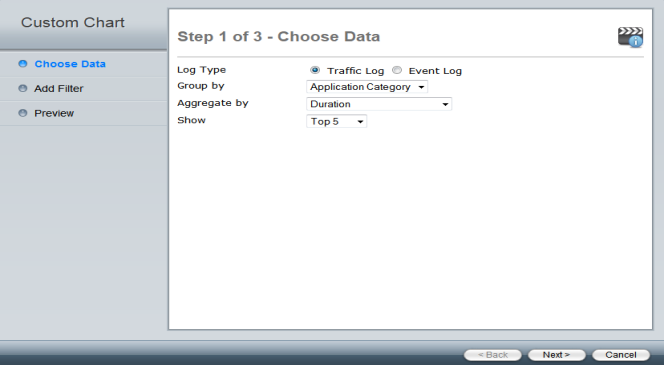
Select the video icon to view the FortiManager 5.0: How to create a custom chart tutorial. |
Log Type | Select either Traffic Log or Event Log. |
Group by | The options in the drop-down list are dependent on the log type selected. The Group by option will be displayed in the column 1 or Y-axis in the chart. Traffic log attributes: Application Category, Application ID, Application Name, Attack, Destination Country, Destination Interface, Destination IP, Device Type, Source Interface, Source IP, Source SSID, User, Virus, VPN, VPN Type, Web Category, or Website (Hostname). Event log attributes: VPN Tunnel or Remote IP. |
Aggregate by | Select one of the following from the drop-down list: Duration, Received Bytes, Sent Bytes, Total Bytes, Total Sessions or Total Blocked Sessions. The Aggregate by option will be displayed in the column 2 or X-axis in the chart. |
Show | Select one of the following from the drop-down list: Top 5, Top 10, Top 25, Top 50, or Top 100. |