Event Management
Events
In Event Management you can configure events based on logging filters. You can select to send the event to an email address, SNMP server, or syslog server. Events can be configured per device or per log array. You can create events for FortiGate, FortiCarrier, FortiMail, and FortiWeb devices.
Events can also be monitored and the logs associated with a given alert can be viewed.
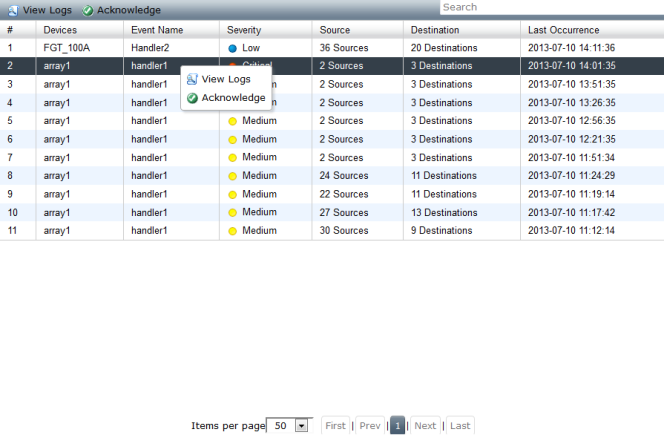
The events page provides a list of the generated events. Right-clicking on an alert in the table gives you the option of viewing the log messages associated with that alert and acknowledging the event. When the event is acknowledged, it is removed from the event list.
To view events, in the Event Management tab, go to Event Management > Events. When ADOMs are enabled, select the ADOM, and then select Events.
The following table lists page information and options:
View Logs | Select an event entry and select View Logs in the toolbar. A dialog window will open displaying the logs associated with the event. Optionally, you can right-click an event entry and select View Logs. |
Acknowledge | Select an event entry and select Acknowledge in the toolbar to remove the event from the list. Optionally, you can right-click the entry and select Acknowledge to remove the event from the list. |
# | The number assigned to the event. |
Devices | The device, devices, or log array that is associated with the event. |
Event Name | The name of the Event Handler that triggered the event. |
Severity | The severity level of the event. Event severity level is a user configured variable. The severity can be Critical, High, Medium, or Low. |
Source | The number of sources for the event. |
Destination | The number of destinations for the event. |
Last Occurrence | The date and time that the event was created and added to the events page. |
Items per page | Select to display 50, 100, or 150 items per page. |
First, Prev, 1, 2, .., Next Last | Navigate pages in the events page. |
To view log messages associated with an event:
1. Go to Event Management > Events and select an event.
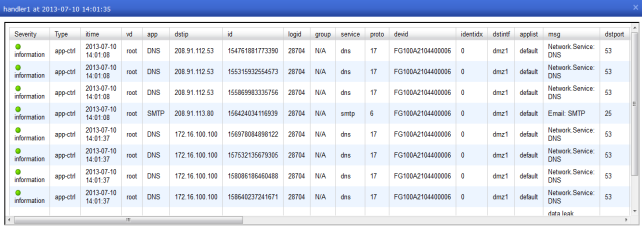
2. Select the event and select View Logs in the toolbar. Optionally, you can select the event, right-click and select View Logs in the pop-up menu.
The logs list the following:
Severity Type itime vd app dstip id logid | group service proto devid identidx dstintf applist msg | dstport type profile dstname profilegroup dtime sessionid profiletype | policyid srcintf srcip count apptype level url alert_log_seqnum | srcport srcname subtype attackid action hostname user |
3. Close the dialog box to return to the events page.
To acknowledge events:
1. Go to Event Management > Events and select the event or events you would like to acknowledge. To select multiple alert events press the CTRL button and select events using the left-click button on your mouse.
2. Select Acknowledge in the toolbar. Optionally, you can right-click and select Acknowledge in the pop-up menu.
3. Select OK in the confirmation dialog box to acknowledge the selected alert event or events.