This section includes the following information:
The baseline traffic statistics are the maximum value (rate or count) measured by the counter during the observation period. The system saves data points every five minutes. During a 1-hour period, for example, there are 12, 5-minute observation periods. FortiDDoS saves a data point for each 5-minute interval. If you choose a 1-hour period, the system generates the maximum value across these 12 periods of 5-minute intervals.
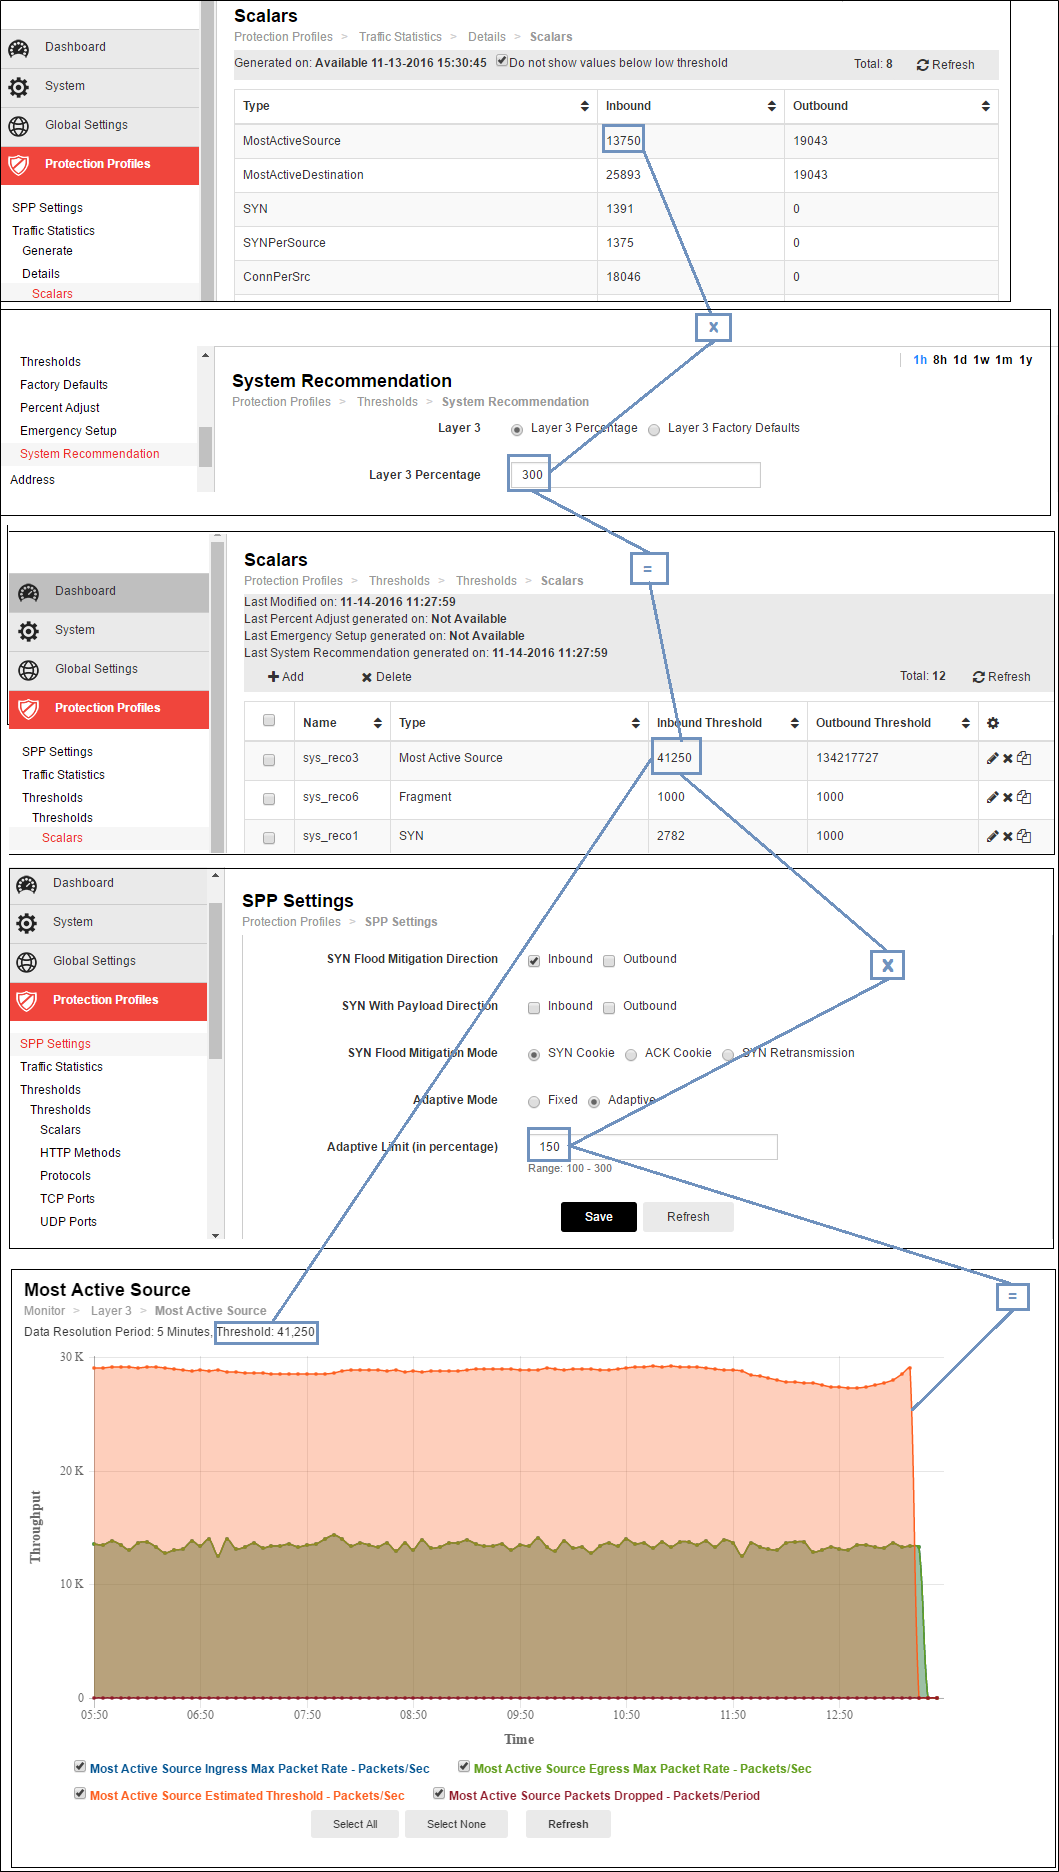
The baseline statistics are used to establish the configured minimum threshold and ultimately the absolute maximum rate limit. Figure 40 illustrates the relationship between the baseline statistics, threshold settings, and monitor graphs.
In Figure 40:
Figure 40: Relationship baseline traffic statistics-thresholds
You can generate baseline traffic statistics based on the following observation periods:
Use a time period that is representative of typical traffic volume and has had no attacks.
Before you begin:
|
|
To configure with the CLI, use a command sequence similar to the following:config spp edit <spp_name> config ddos spp threshold-report set generate {enable | disable} set report-period {last-hour | last-8-hours | last-24-hours | last-week | last-month | last-year} end |
You can review the statistics that are the basis of the system recommended thresholds.
Before you begin:
Note: By default, the system does not display parameters with counts lower than the following.
| Layer | Low threshold |
|---|---|
| 3 | 100 |
| 4 | 500 |
| 7 | 200 |
Clear the Do not show values below low threshold option if you want to see these low counts.