Connectivity issues
One of your first tests when configuring a new SPP should be to determine whether legitimate traffic is forwarded to protected resources.
Checking hardware connections
If packets are not forwarded by the FortiDDoS appliance, it might be a hardware problem.
To check hardware connections:
• Ensure the network cables are properly plugged into the interfaces on the FortiDDoS appliance.
• Ensure there are connection lights for the network cables on the appliance.
• Change the cable if the cable or its connector are damaged or you are unsure about the cable’s type or quality.
• Connect the FortiDDoS appliance to different hardware to see if that makes a difference.
• In the web UI, select System > Status > Dashboard. In the System Status widget, ensure that the status indicators for the ports that are in use are green (indicating that physical connections are present) or flashing green (indicating that data is flowing). Hover over the indicator for further status information.
If any of these checks solve the problem, it was a hardware connection issue. You should still perform some basic software tests to ensure complete connectivity.
If the hardware connections are correct, and the appliance is powered on but you cannot connect using the CLI or web UI, you might be experiencing bootup problems. You might have to reimage the system. See
“Restoring firmware (“clean install”)”.
Data path connectivity
You can use ping and other methods to verify that FortiDDoS appliance forwards packets to protected servers.
Verifying the path between client and server
If you are testing connectivity using a client that is directly connected to the appliance, use ping to test the traffic flow. For indirect connections, use traceroute.
To verify routes between clients and your servers using ping
1. Try to communicate with the server from the client using the ping command. Use the following graphs to detect if the traffic has travelled through the FortiDDoS appliance:
• Monitor > Port Statistics > Packets
• Monitor > Port Statistics > Bits
• Monitor > Layer 3 > Protocols (protocol 1 or 58)
If you do not see the expected count of bits or packets, continue to the next step.
2. Use the ping command on both the client and the server to verify that a route exists between the two. Test traffic movement in both directions: from the client to the server, and the server to the client. Servers do not need to be able to initiate a connection, but must be able to send reply traffic along a return path.
To verify routes between clients and your servers using traceroute
Use the tracert or traceroute command on both the client and the server (depending on their operating systems) to determine if there is a point of failure along the route.
If the route is broken when it reaches the FortiDDoS appliance, first examine its network interfaces and routes. To display network interface information, enter the CLI command:
show system interface
Testing data path routes and latency with traceroute
traceroute sends ICMP packets to test each hop along the route. It sends three packets to the destination, and then increases the time to live (TTL) setting by one, and sends another three packets to the destination. As the TTL increases, packets go one hop farther along the route until they reach the destination.
Most traceroute commands display their maximum hop count — that is, the maximum number of steps it will take before declaring the destination unreachable — before they start tracing the route. The TTL setting may result in routers or firewalls along the route timing out due to high latency.
Where ping only tells you if the signal reached its destination and returned successfully, traceroute shows each step of its journey to its destination and how long each step takes. If you specify the destination using a domain name, the traceroute output can also indicate DNS problems, such as an inability to connect to a DNS server.
By default, traceroute uses UDP with destination ports numbered from 33434 to 33534. The traceroute utility usually has an option to specify use of ICMP ECHO_REQUEST (type 8) instead, as used by the Windows tracert utility. If you have a firewall and you want traceroute to work from both machines (Unix-like systems and Windows) you will need to allow both protocols inbound through your firewall (UDP ports 33434 - 33534 and ICMP type 8).
To trace the route to a server from a Microsoft Windows computer:
1. Go to the Windows command line interface (cmd.exe).
2. Enter the command:
tracert {<destination_ipv4> | <destination_fqdn>}
If the appliance has a complete route to the destination, output similar to the following appears:
Tracing route to www.fortinet.com [66.171.121.34]
over a maximum of 30 hops:
1 <1 ms <1 ms <1 ms 172.16.1.2
2 2 ms 2 ms 2 ms static-209-87-254-221.storm.ca [209.87.254.221]
3 2 ms 2 ms 22 ms core-2-g0-1-1104.storm.ca [209.87.239.129]
4 3 ms 3 ms 2 ms 67.69.228.161
5 3 ms 2 ms 3 ms core2-ottawa23_POS13-1-0.net.bell.ca [64.230.164
.17]
(Output abbreviated.)
15 97 ms 97 ms 97 ms gar2.sj2ca.ip.att.net [12.122.110.105]
16 94 ms 94 ms 94 ms 12.116.52.42
17 87 ms 87 ms 87 ms 203.78.181.10
18 89 ms 89 ms 90 ms 203.78.181.130
19 89 ms 89 ms 90 ms fortinet.com [66.171.121.34]
20 90 ms 90 ms 91 ms fortinet.com [66.171.121.34]
Trace complete.
Each line lists the routing hop number, the 3 response times from that hop, and the IP address and FQDN (if any) of that hop. Typically a value of <1ms indicates a local router.
If the appliance does not have a complete route to the destination, output similar to the following appears:
Tracing route to 10.0.0.1 over a maximum of 30 hops
1 <1 ms <1 ms <1 ms 172.16.1.2
2 <1 ms <1 ms <1 ms 172.16.1.10
3 * * * Request timed out.
4 * * * Request timed out.
5 ^C
The asterisks ( * ) and “Request timed out.” indicate no response from that hop in the network routing.
To trace the route to a server from a Linux or Mac OS X computer
1. Open a command prompt, or on Mac OS X, use the Network Utility application.
2. Enter (the path to the executable varies by distribution):
traceroute {<destination_ipv4> | <destination_fqdn>}
If the appliance has a complete route to the destination, output similar to the following appears:
traceroute to www.fortinet.com (66.171.121.34), 30 hops max, 60 byte packets
1 172.16.1.2 (172.16.1.2) 0.189 ms 0.277 ms 0.226 ms
2 static-209-87-254-221.storm.ca (209.87.254.221) 2.554 ms 2.549 ms 2.503 ms
3 core-2-g0-1-1104.storm.ca (209.87.239.129) 2.461 ms 2.516 ms 2.417 ms
4 67.69.228.161 (67.69.228.161) 3.041 ms 3.007 ms 2.966 ms
5 core2-ottawa23_POS13-1-0.net.bell.ca (64.230.164.17) 3.004 ms 2.998 ms 2.963 ms
(Output abbreviated.)
16 12.116.52.42 (12.116.52.42) 94.379 ms 94.114 ms 94.162 ms
17 203.78.181.10 (203.78.181.10) 122.879 ms 120.690 ms 119.049 ms
18 203.78.181.130 (203.78.181.130) 89.705 ms 89.411 ms 89.591 ms
19 fortinet.com (66.171.121.34) 89.717 ms 89.584 ms 89.568 ms
Each line lists the routing hop number, the IP address and FQDN (if any) of that hop, and the 3 response times from that hop. Typically a value of <1ms indicates a local router.
If the appliance does not have a complete route to the destination, output similar to the following appears:
traceroute to 10.0.0.1 (10.0.0.1), 30 hops max, 60 byte packets
1 * * *
2 172.16.1.10 (172.16.1.10) 4.160 ms 4.169 ms 4.144 ms
3 * * *
4 * * *^C
The asterisks ( * ) indicate no response from that hop in the network routing.
Likewise, if the computer’s DNS query cannot resolve the host name, output similar to the following appears:
example.lab: Name or service not known
Cannot handle "host" cmdline arg `example.lab' on position 1 (argc 1)
Checking routing
ping and traceroute are useful tools in network connectivity and route troubleshooting for management network interfaces.
Since you typically use these tools for troubleshooting only, allow ICMP (the protocol used by these tools) on interfaces only when you need them. Otherwise, disable ICMP for improved security and performance.
By default, FortiDDoS appliances respond to ping and traceroute. However, if the appliance does not respond, and there are no firewall policies that block it, ICMP type 0 (ECHO_REPSPONSE) might be effectively disabled.
To enable ping and traceroute responses from FortiDDoS:
1. Go to System > Network > Interface.
To access this part of the web UI, you must have Read-Write permission in your administrator's account access profile to items in the System category.
2. In the row for the management network interface which you want to respond to ICMP type 8 (ECHO_REQUEST) for ping and UDP for traceroute, click Edit.
A dialog appears.
3. Enable ping.
4. Click OK.
The appliance should now respond when another device such as your management computer sends a ping or traceroute to that management interface.
Examining the routing table
When a route does not exist, or when hops have high latency, examine the routing table. The routing table is where the FortiDDoS appliance caches recently used routes.
If a route is cached in the routing table, it saves time and resources that would otherwise be required for a route lookup. If the routing table is full and a new route must be added, the oldest, least-used route is deleted to make room.
To check the routing table for the management network interface in the CLI, enter:
diagnose netlink route list
Trouble with IPv6 settings
If you deploy FortiDDoS in a network that has IPv6 traffic, you must go to Global Settings > Settings and configure IPv6 Prefix Length and IPv6 Prefix settings. FortiDDoS uses these settings to assign incoming IPv6 packets to the appropriate SPP and for destination tracking.
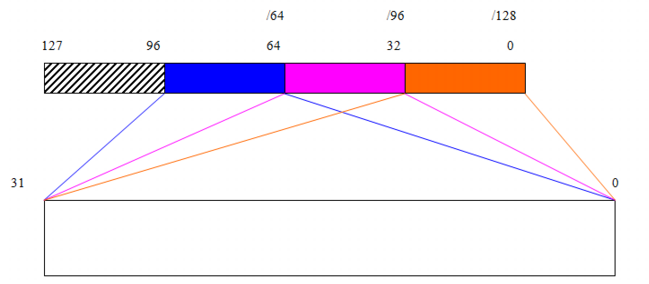
The prefix values define 32-bit “windows” within the 128-bit value of the IPv6 address. When you select a prefix, you specify which portion of the address is fixed. FortiDDoS uses the 32-bit portion of the address that follows the fixed portion (that is, the “window”) to assign profiles.
The illustration shows these windows as blue, magenta and orange blocks.
In Global Settings, the IPv6 Prefix Length setting identifies the fixed portion of your IPv6 address space that precedes the 32-bits of an IPv6 address that FortiDDoS uses to match IPv6 packet traffic with an SPP.
For example, to assign servers and other resources to SPPs based on the portion of an address that is found in the 32-bit window that comes after the initial 64 bits of the address, for IPv6 Prefix, select 64. If the value you want to use falls between the values that FortiDDoS provides, select the lower prefix value.
IPv6 Prefix Length | IP address bits used for SPP assignment |
32 | 33-64 |
64 | 65-96 |
96 | 97-128 |
In Global Settings, the IPv6 Prefix value is the IPv6 prefix, not including the mask. You can specify more than 64 bits of the IPv6 address, but FortiDDoS ignores any values beyond the initial 64 bits.
In SPP policy rules:
• Ensure that all IPv6 subnets use the same value for their initial bits (for example, they all begin with 9001:1234:5678:abcd).
• Ensure that IP Address/Prefix values for the SPP policy are consistent with the Global Settings > Settings IPv6 Prefix Length and IPv6 Prefix configuration. For example, if the global IPv6 Prefix Length is 64 and the IPv6 Prefix is 9001:1234:5678:abcd::, a valid SPP IP Address/Prefix value is 9001:1234:5678:abcd:1122:3344:5566:7788/70.