Using FortiAnalyzer to collect DDoS attack logs
FortiAnalyzer platforms integrate network logging, analysis, and reporting into a single system, delivering increased knowledge of security events throughout your network.
FortiAnalyzer now supports the FortiDDoS attack log. FortiAnalyzer includes the following predefined reports for FortiDDoS:
• Attacks by time period
• Attackers by time period
• Top 20 Attacks
• To 20 Attack Types
Refer to FortiAnalyzer
documentation for version support details and detailed procedures on how to use FortiAnalyzer. This section describes the workflow for collecting DDoS attack logs.
To set up log collection:
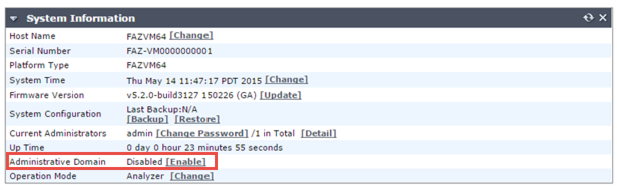
1. On FortiAnalyzer, go to the System Information widget and enable Administrative Domains.
2. On FortiDDoS, use the DDos Attack Log Remote configuration to send logs to the FortiAnalyzer IP address.
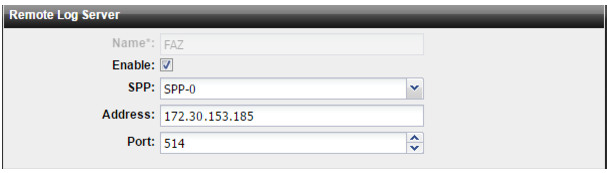
After you have saved the configuration, FortiDDoS begins sending logs to FortiAnalyzer.
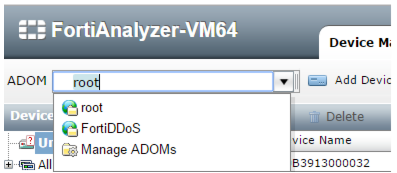
3. On FortiAnalyzer, go to the Device Manager. Once FortiAnalyzer begins receiving logs from FortiDDoS, FortiDDoS appears in the Administrative Domains (ADOM).
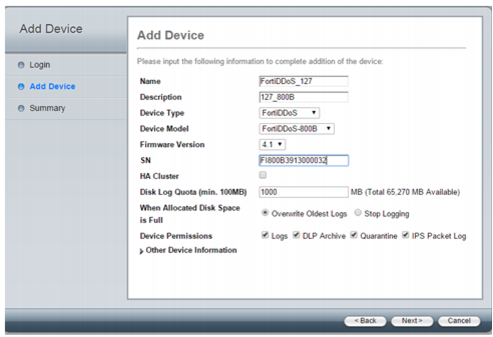
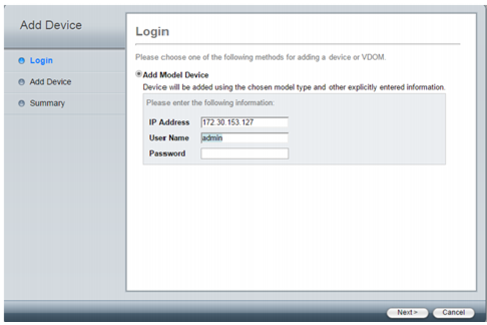
4. Select FortiDDoS and click
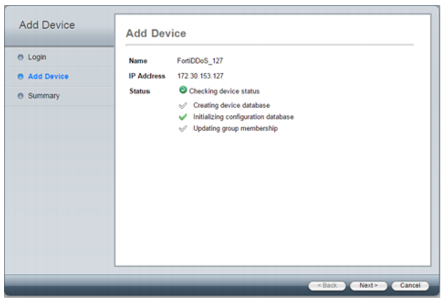
Add Device to start the Add Device wizard. Complete the wizard.
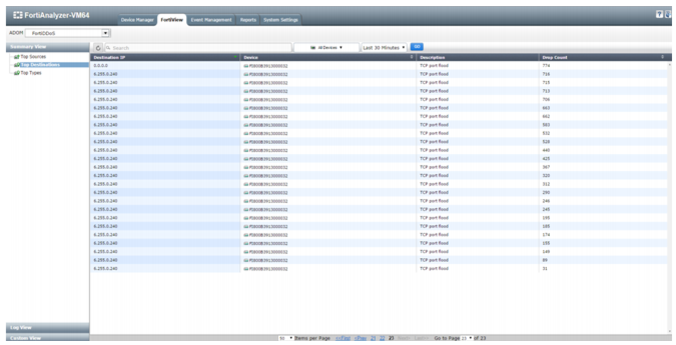
5. Go to the Device Manager and verify that the FortiDDoS device has been added.
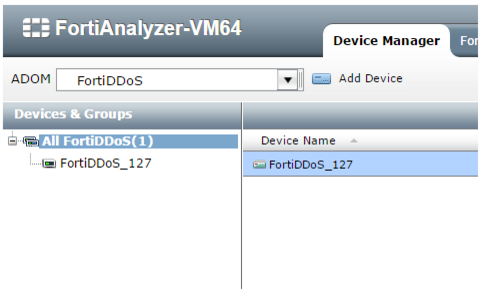
6. Once the device has been successfully added, you can now go to FortiView to see the attack log.