Using the Server Load Balance report
The Server Load Balance report is a graph of throughput for the SLB virtual servers with the top throughput.
Before you begin:
• You must have Read-Write permission for Log & Report settings.
To generate a report:
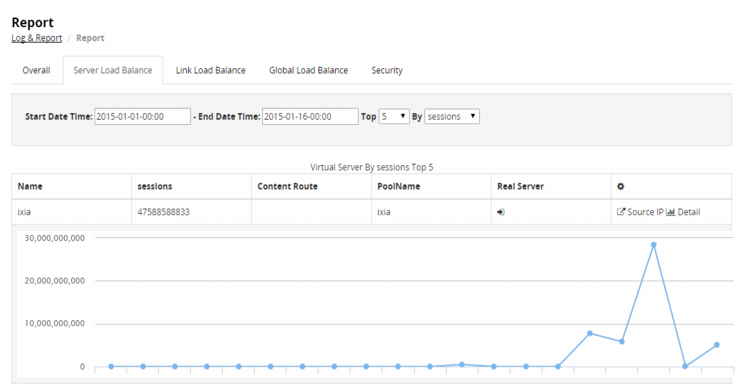
1. Go to Log & Report > Report.
2. Click the Server Load Balance tab.
3. Specify a time range for the report.
4. Select the number of virtual servers to include in the graph.
5. Select whether to use inbound traffic, outbound traffic, or number of sessions as the measure of throughput.
The report is added to the report table.
6. Click Detail to display the report graph.
Note: There is no Generate button for this report. A report is generated automatically when you change the date/time or query terms (Top or By).